
9 Stocks Beating the Market 10-to-1… Here’s What They Have in Common
It’s been a tough year for investors. The S&P 500 tanked more than 11% by the middle of February on crashing oil prices, concerns over China and Europe’s health, and a “hawkish” Federal Reserve that planned to hike short-term interest rates.
Then the market pivoted faster than basketball superstar LeBron James inside the key. The rebound rally that followed was one of the fastest in history, but the S&P 500 is still up just 1% year to date.
However, in the midst of all this volatility, there have been some clear outperformers.
Nine of the 12 open positions in the Alpha Trader portfolios are up double digits year to date. That’s more than 10 times better than the S&P 500.
For those of you who aren’t familiar with it,Alpha Trader is an exclusive research service that uses a proprietary indicator known as the Alpha Score, delivering the highest-ranked stocks across 10 different types of investments that range from small caps to blue chips.
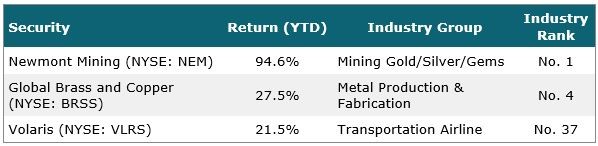
While I don’t want to give out all the names of this year’s top performers, here are three to give you a taste: Newmont Mining (NYSE: NEM), Global Brass and Copper (NYSE: BRSS)and Volaris (NYSE: VLRS).
Other than their impressive year-to-date performances, these nine companies couldn’t be more different. They span a number of market sectors, from airlines to mining, and range in size from small to large cap. One is a stock we picked up just a few weeks ago, and one has been delivering profits for months.
Of course, these stocks do have something thing in common: They all had high Alpha Scores when I recommended them. In fact, that’s what initially tipped me off to their immense potential.
The Alpha Score is a powerful indicator derived by combining two of the market’s most effective metrics.
The first metric, relative strength (RS), helps us pinpoint stocks that are the most likely to outperform the market in the coming months. The power of this indicator has been proven by extensive research spanning decades, yet because it’s not widely used, it’s still a highly effective indicator for those in the know.
The second metric, cash flow relative strength (CFRS), provides a key fundamental measure of a company’s profitability. Cash flow is the lifeblood for successful businesses — the better the cash flow growth, the better the business — a reality that’s reflected in stock prices. Investing greats Warren Buffett and Charlie Munger are spot on in their opinions on the importance of cash flow — it needs to be healthy, consistent and predictable.
Cash flow is also one of the most reliable numbers in finance. While companies can manage earnings to meet analysts’ expectations or inflate balance sheet assets using misleading reserve allowances, this metric is much harder to fake.
Strong cash flow growth becomes more important than ever during times of market turbulence, as we saw in the first quarter. By screening for high CFRS during market downtrends, we end up with companies that are able to outgrow their peers even in very difficult conditions.
When the market eventually turns higher, those stocks will be sitting in the catbird seat, perfectly positioned to deliver market-beating returns when the rising tide flows back in. The same can be said for stocks with high RS scores during turbulent periods: The stocks that hold up the best during the storm also sail the best when the sky clears.
Now, there’s one more advantage these winners have going for them — industry group strength.
Those who follow Alpha Trader know that I frequently mention how well a stock’s industry group is performing. Many times, not only are my recommendations the top performers within their respective industries, but those industries are top performers, as well.
And according to market wizard William O’Neil, that’s exactly what we should be looking for.
In his extensive studies of winning growth stocks, O’Neil, who founded Investor’s Business Daily, has shown that most top-performing stocks are found in the top quartile of groups, and that group action determines at least half of a stock’s performance. With 197 different industry groups to choose from, the top quartile represents the 49 groups with the best performance over the past six months.
Not surprisingly, nearly all of our big year-to-date winners come from the top quartile of industry groups, including all three of the stocks mentioned by name.
This is why I stress industry group strength in my stock recommendations. It’s a jet stream that usually underpins strong, persistent stock price uptrends.
Now, just to be clear, these stocks were not selected because they belong to the top quartile of industry groups. Rather, they were selected primarily because of their high RS rank (above 70) and high CFRS rank (above 70) when they were initially recommended. It is only when that criteria is met that I drill down into other factors, such as strength of industry group, to determine which stocks make the cut for the Alpha Trader portfolio.
This week, I added three new stocks to our portfolios, and not coincidentally, two of them hail from outperforming industry groups in addition to having high Alpha Scores.
The first is an international metal company that belongs to the “Metal Production & Fabrication” group (No. 4), and the second is a bargain outlet growing like gangbusters that belongs to the “Retail Discount & Variety” group (No. 7). And while our third pick’s industry group just barely misses the top quartile, this Brazilian chemicals company is no less impressive, with recent price action targeting a 50% breakout from here.
If you’re interested in receiving the top Alpha Score picks twice a month, or simply learning more about how this indicator works, I put together a presentation that explains everything you need to know. You can access it here.


