This chart illustrates why investing in stocks is just the worst

Earnings are what investors ultimately want out of the companies they invest in. Earnings, and the expectations for earnings growth, are therefore what give stock prices their value.
Stock prices and any revisions to earnings expectations should then go in the same direction, right?
While that’s a principle that plays out in the market in the long run, it unfortunately isn’t promised in the short run.
In other words, you may know that earnings expectations will sour. But you may actually lose money trading on what may be correct information. This is why investing in stocks can be an incredibly frustrating exercise for even the most patient people.
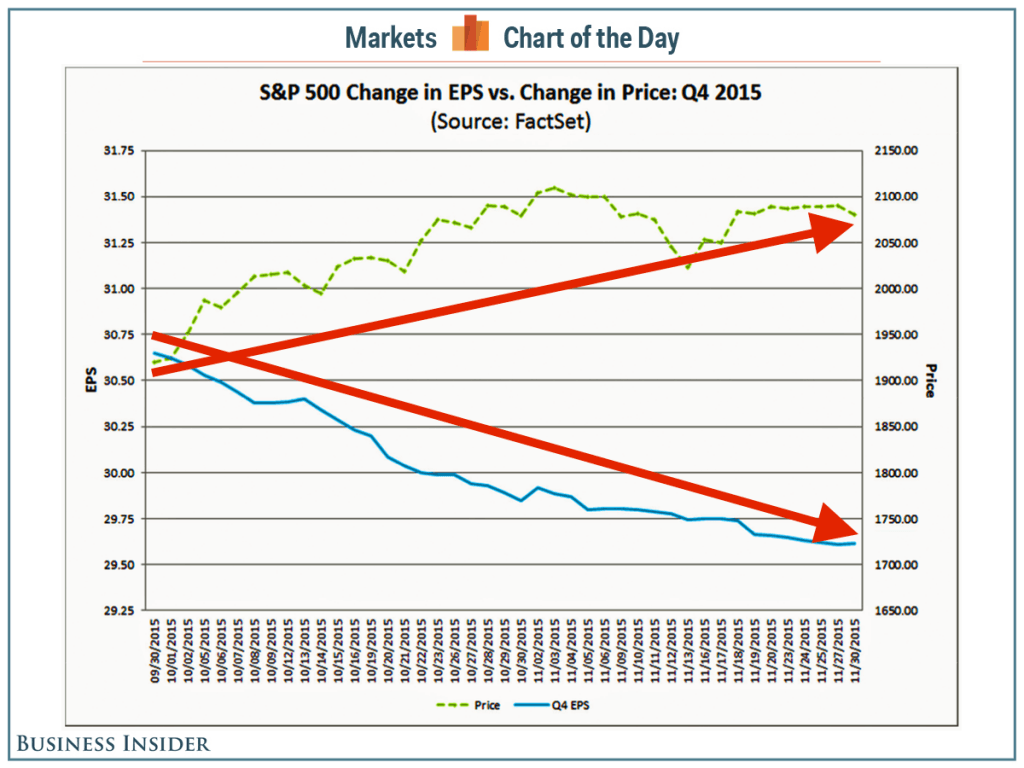
Take this chart that FactSet’s John Butters updates regularly. It shows the trajectory of the S&P 500 with the trajectory of analysts’ forecast for current-quarter earnings. Prices have been going up even as analysts’ forecasts have been coming down.
“During the first two months of the fourth quarter, analysts lowered earnings estimates for companies in the S&P 500 for the quarter,” Butters wrote. “The Q4 bottom-up EPS estimate (which is an aggregation of the estimates for all the companies in the index) dropped by 3.4% (to $ 29.61 from $ 30.65) during this period.”
 FactSet
This is actually a trend we’ve been keeping track of for years. In fact, according to Morgan Stanley’s Adam Parker, the trend in earnings revisions has been negative since 1976.
So, what gives?
First it’s important to note that these are expectations that are getting revised down, which suggests analysts just have a tendency to be a little too optimistic.
Also, it’s a reminder that the direction of earnings and expectations for earnings alone reveal very little about where stock prices are headed in the near term. (Read more about this hereand here.) Earnings and price often separate, and it manifests in expanding and contracting valuations.
Another way of saying this is that it’s nearly impossible to predict the near-term direction of market multiples like the forward price-to-earnings ratio.
“We don’t think anyone can forecast the price-to-forward earnings ratio for the S&P 500 in time frames less than a few years,” Parker said recently. “We assign little value to this attempt other than just framing and dimensioning some of the key variables, and we are constantly amazed when people ask about the market multiple, given that all of our prior work has shown basically no empirical evidence to support forecasting claims. Why more people don’t understand this is unclear to us. Many times those making the forecasts are simply unaware that they can’t actually do it accurately, rely on spurious correlations, or don’t bother to back-test their own theories.”
Yes, even seasoned pros like Parker are willing to acknowledge that charts like these are basically unpredictable and unexplainable.
Keep all this in mind the next time someone says stock prices will go down because they’re too expensive.


