
Breakout Signals This Oil Stock is Ready to Rally
Even though crude oil is languishing below $ 50 a barrel, the energy sector has been showing signs of life in the past month. Since rebounding off its late-September low, the sector has outperformed the S&P 500 by more than 7 percentage points.
Some oil services stocks have already broken out to the upside, but I spotted one that is just starting to make its move. While the long-term trend is still officially to the downside, every long-term reversal starts with a short-term one.
And that’s what we’re seeing now with oil and gas exploration and production company Murphy Oil (NYSE: MUR).
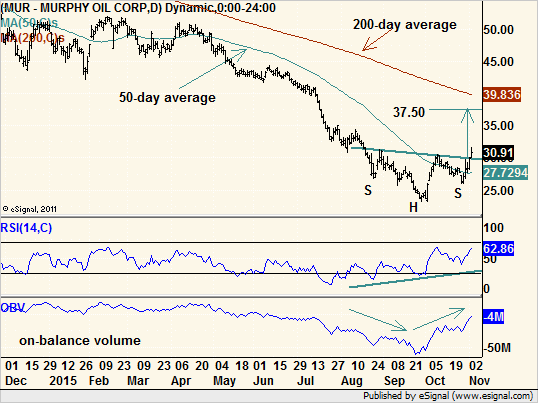
The easiest pattern to spot on the chart is an upside down or inverted head-and-shoulders. It is defined by a central trough (head) surrounded by roughly equal but shallower troughs (shoulders). A line connects the highs between these troughs to define the resistance line known as the neckline.
Because this is a reversal pattern, we expect to see many indicators setting higher lows as the pattern progresses. Indeed, we’re seeing that in momentum readings for Murphy Oil, including the Relative Strength Index (RSI).
But that alone is not enough to confirm a bottom. So we should also look at non-momentum-based indicators.
On-balance or cumulative volume fits that bill. This indicator keeps a running total of volume changing hands on up days minus volume on down days. When it is rising, we presume the bulls are more aggressive and money is flowing into the stock. That is the case here.
Rising momentum and rising on-balance volume are proxies for rising speed and power in a stock’s upward move. All that is left is confirmation in price in the form of a breakout.
MUR closed above the neckline of the inverted head-and-shoulders pattern on Nov. 2, and it has held there for two days. As usual, nothing is perfect on the charts, and volume on the breakout was not very impressive. But the oil services subsector has broken out and, as I mentioned, the energy sector as a whole is finally beating the market. Taken together, these are good enough reasons to overlook modest volume.
As we can see in the chart, the right shoulder, which was created by the pause in price in October, sat right on the 50-day moving average. Therefore, the price breakout from the head-and-shoulders also confirmed a breakout through the 50-day.
Based on a simple measuring technique of projecting the pattern height up from the breakout, we can see the stock targeting its 200-day moving average, just below $ 40, which is roughly 30% above current trading.
That may seem like an aggressive target, but in the context of the 14-month, 66% decline that preceded it, it is barely a 30% retracement.
We’ll be a little more conservative and set our target at $ 37.50, which could result in a 23% gain in a few weeks. And the $ 0.35 dividend (4.6% yield) the company is scheduled to pay out on Dec. 1 to shareholders of record on Nov. 16 offers a nice bonus.
Recommended Trade Setup:
— Buy MUR at the market price
— Set stop-loss at $ 28.50
— Set initial price target at $ 37.50 for a potential 23% gain in five weeks
Note: Over the next month, things are going to get crazy. Popular stocks, both large and small, are going to whipsaw 10%… 20%… even 30% or more — overnight. It’s unavoidable and it has Wall Street on edge. If you act quickly, you can protect yourself. Click here to find out how.


