
Time Your Buys Like a Pro
For traditional buy-and-hold investors, market timing probably doesn’t mean much.
But here’s the thing: It should. Believe it or not, many smart people are investing the wrong way every single day.
These investors see a stock on the rise and chase shares when everyone else is buying – and that means they’re often buying too high. And then, when the market sells off, they dump shares along with everyone else – often at too low a price.
Professional traders know this and mint fortunes off the herd.
But by using one simple indicator, you can time your entries alongside the elite traders.
A Band-Aid for Your Portfolio
Once you’ve identified a quality stock, the first step is to buy shares at the lowest price you can. You see, stocks never go up or down in a straight line.
When a stock trends upward, it ascends the chart in waves. Shares rally under momentum and fall on profit taking.
In order to buy the dips and sell the rallies, I use one of my favorite technical indicators: Bollinger Bands.
Developed by John Bollinger in the 1980s, Bollinger Bands are volatility bands placed above and below a stock’s moving average. The bands’ values are based on standard deviations from the moving average.
You can select any moving average and deviation, but traders typically use the 20-day moving average (DMA) and set the Bollinger Bands at two standard deviations above and below the DMA.
I love Bollinger Bands because they combine several technical tools into an easy-to-use trend indicator. And because the bands utilize standard deviations, they adjust automatically for rapid changes in volatility.
Once the bands are set, price action bounces between the upper and lower band as momentum swings. The idea is to buy shares as they “tag” the lower band and sell as they tag the upper band. Let’s look at an applied example.
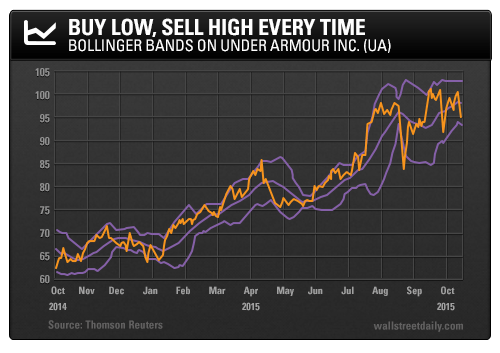
Here’s a one-year chart of Under Armour Inc. (UA), one of 2015’s hottest stocks.
Over the last year, shares have outperformed the S&P 500 by more than 60%.
As you can see, price action is contained between the Bollinger Bands. And by timing your entry on a dip to the lower band, you can increase your profits by several percentage points.
On the chart, you’ll notice three distinct buy signals: December 2014-January 2015, May-June 2015, and August 2015. After executing a buy, you can sell on the upper band tag or hold until you’ve hit your profit target.
Now, on a pricier large-cap stock, a few percentage points in profit might not mean much. But if you’re an options trader or short-term trader, those points can be the difference between small gains and big money. And the bands become even more valuable when trading volatile small-cap and mid-cap stocks.
Bottom line: Don’t chase red-hot stocks at recent highs. Use Bollinger Bands to time the dips and get more bang for your buck.
On the hunt,
Jonathan Rodriguez


