
Never Pay More Than MSRP
Only suckers buy at “top valuation.”
Knowledge Is Power
What do I mean by “top valuation?”
That is what occurs when traders get so enamored of a stock that they’re willing to pay more than everybody else historically paid for the exact same shares, based on price to earnings (P/E) ratios. This often goes hand-in-hand with also accepting sub-par dividend yields, if applicable.
Nobody can predict how large a bubble can get before bursting. It is possible, however, to recognize what over-inflated stocks look like. That way you can avoid holding or overpaying near tops. Failure to sell when stocks get way too pricey often results in years of under-performance.
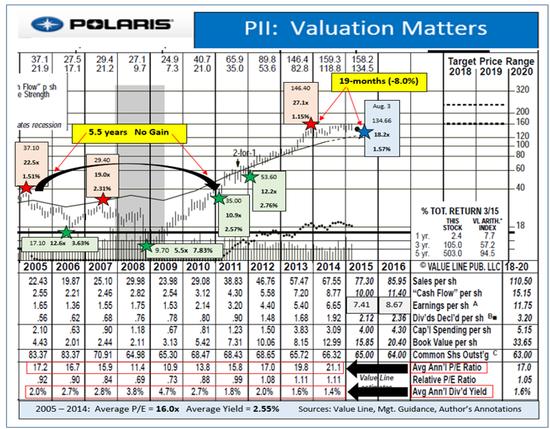
The long-term data on Polaris Industries (PII) makes for a good example of how knowledge of valuation medians could have averted disaster. Remember, we want to compare each stock’s “snapshot” metrics with what that same company typically fetched in actual market trading.
In the decade ended last year, Polaris averaged a 16.0x multiple while paying around 2.55% in current yield. At PII’s 2005 peak of $ 37.10, its stock was selling for 22.5x that year’s estimate with just a 1.51% dividend. The shares were about to fall almost 54% within 17 months.
Polaris bounced back to somewhat overpriced levels in 2007 before carving out a final sickening bottom of $ 9.70 during the worst of 2008’s crash. Stubborn traders with no feel for “value” who held fast at 2006’s pinnacle… needed to wait about five and a half years before getting into the black.
Conversely, buyers at lower than average valuations (green-starred on the chart below) had plenty of chances to make great profits on the same shares that had been frustrating others.
A multi-year EPS surge allowed value-oriented players to hang in there for huge gains from 2009 through the first half of 2013. Rapidly rising fundamentals outpaced the share price movement keeping P/Es in check and leaving dividends in above-average territory.
“Top valuation” reared its ugly head again in late 2013. Polaris then commanded north of 27x trailing earnings. Its yield, at 1.15%, was lower than it sat near 2005’s share price peak. PII posted all-time best numbers in 2014.
The current year is on pace for another record yet the shares, on Aug. 3, 2015, were sitting about 8% below 2013’s high water mark.Polaris was so expensively valued 19 months ago that even great results couldn’t sustain the share price.
At $ 134.66, PII was still trading a bit above its normalized valuation.
Polaris was not just an isolated example.
Take a look at the facts on Air Products (APD) dating back to 2008. Over those recent most seven years, APD averaged a 16.7x multiple along with a 2.63% yield. At 2008’s high point, APD sported an above-average 21.3x P/E and a sub-par 1.60% dividend yield.
Those who paid up for APD’s momentum in the first half of 2008 ended up regretting their decision. Shareholders at that pre-crash valuation didn’t see $ 106 again over the subsequent five years.
APD’s interim rally back to $ 98 in 2011 merely served as a false start. The shares sunk quickly back to $ 72.30. As with Polaris, APD’s green-starred, clearly undervalued periods, when APD was available at below average P/Es and with higher than typical yields, offered traders great entry points.
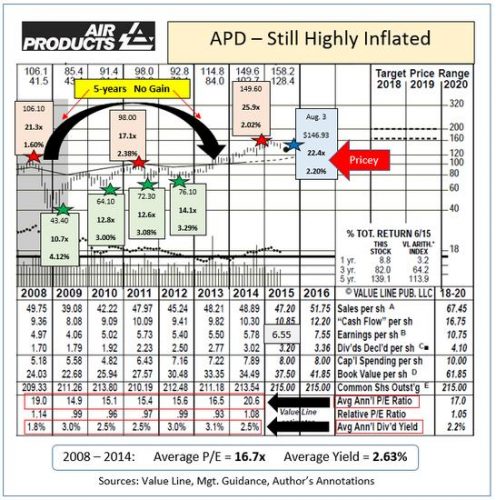
Last year’s high of almost $ 150 looked expensive, yet was followed by a further run to over $ 158. Predictably, that upward trajectory didn’t continue. Despite terrific first-half 2015 results, APD was only holding at a still-pricey $ 146.93 intra-day on Aug. 3.
Valuation is the single most important predictor of future stock price behavior.Understanding where an individual stock falls within its own historical valuation range will improve your batting average while providing peace of mind.
Nobody wants to be the sucker who paid more than anyone else for the same merchandise.
Disclosure: No positions in either PII or APD.


