
VIX ETFs – More Truth
As markets continue at a high level, volatility falls and their associated ETF products drop to record lows. As tempting as it is to use such products for hedging or for large gains, the probability of making any ?gain with them is very low (we cite an article below that this some to ~5% through skill.)? This article here is now the 3rd installment of the “Volatility-product(s)” series of research, focusing on the meaning of these high and low records (the prior articles were on failed strategies from even god-like clairvoyance, and the other article was on probability and typical performance.)?
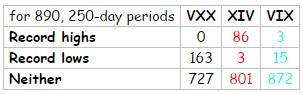
First, let’s explore the various records that have occurred using the VXX over history. We notice that in the past ~3.5 years (890 days), there have been 163 250-day lows, and 0 250-day highs. One year is ~250 trading days, and there has ??never been such a period when one could have profitably bought and held such a product? (not even if we stretched back the VXX data the 2 additional years it has.)? And even if we move to semi-annual periods, there still has been 0 125-day highs (or 0% of the 890 days).
We also notice in the earlier article that only 10% of any 125-day periods in recent years have resulted in a gain, so it only makes directional sense that virtually none of the 10% would be both a gain and a 125-day high, jointly.
Now, one might state that part of the reason for this asymmetry in records is that because over the past ~3.5 years, volatility has come down. And this is partially true, though most could not predict that (else they would have been buying stocks on margin well in advance of late 2011). The XIV, or the inverse of the VXX, has had 86 250-day highs (or ~10% of the 890 days). But the VIX, which the VXX is better follows, has had 3 250-day highs, and only 15 250-day lows.
This is a much better balance than VXX that again has no 250-day highs, and 11 times as many 250-day lows! In the past year (as opposed to the fuller 890 day history we described above) things are more difficult for any of the volatility products. Among the VIX, VXX, and XIV, in the past 250 days, there have only been 45 250-day records (so only 6% of 750 overlapping days among the 3 products.) Of those 45 records, 36 of them (80%) have been the VXX making 250-day lows. It’s been a baleful speculative vehicle, across any horizon.
The temptation is great to hedge or seek large returns through the use of these volatility products. ?Many will make a run for it anyway, but few still will really be able to be successful at it (again ~5% are profitable with skill). Instead, the gravitational burden of a continuously decaying product assaults both your performance and intelligence (someone’s going to earn a lot of money from you taking on these new-aged products but it’s not you!)? Part of its charm is that you are tempted by what seems to be a rare buying opportunity through record low prices, only to perpetually see an even lower record low price offered more often than you see a record high.


