
2 Banks’ Breakouts Signal ‘Buy’ Now
It’s been a long time, eight years in fact, since we were able to say with a straight face that Bank of America (NYSE: BAC) and Citigroup (NYSE: C) were good investments.
Moody’s (NYSE: MCO) has already picked up on improvements in their bonds with low investment grade ratings of Baa2 for each. But now the charts tell us that their stocks have also proven themselves and may be ready for further gains.
Since the end of the financial crisis in 2008, Citigroup and Bank of America have severely lagged the rest of the banking sector. While the benchmark KBW Bank Index (BKX) recovered about 63% of its bear market loss, BAC has only regained about 28%. Citi has been dragging along the basement floor with a recovery of about 10%.
Compare that to JPMorgan Chase (NYSE: JPM), which retraced about 140% of its loss, and it’s no wonder investors continue to refer to Citi stock by a quite unflattering nickname.
Citi’s nickname may be unfair, though, if we just consider performance since the 2011 lows. It has tracked BKX fairly closely since that time, and BAC has outperformed the index by about 7 percentage points. While C and BAC started from very low levels relative to other major banks, they have been moving with the pack for the most part.
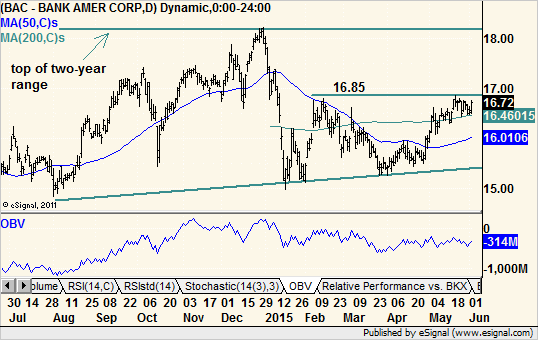
The chart of Bank of America shows it trading just above resistance from 2015 and in the lower half of its two-year trading range.
Its pattern this year is similar to a bullish cup-and-handle, although it doesn’t meet all the criteria. Nevertheless, the chart shows a rally into resistance and a mild pullback allowing BAC to rest before making a breakout attempt. In fact, we can consider the action since mid-May to be a small flag pattern. And on Tuesday and Wednesday, the stock scored a breakout.
Considering the company’s Merrill Lynch unit was slapped with a hefty fine from the Securities and Exchange Commission (SEC) on Monday, that move was extra bullish. Good action on bad news tells us the stock had already priced it in and can quickly move past it.
A run to the top of the trading range just above $ 18 is now in sight. The percentage move may not be huge, but given the proximity of a clear support/resistance level, the risk if this trade does not work out is rather small.
If we look beyond this short-term move, the stock is also at the top of a two-year ascending triangle pattern. A breakout from there could be the trigger to send shares doubling by next year. While we cannot trade hoping that will happen, it is a big light at the end of a very long and dark tunnel.
Recommended Trade Setup:
— Buy BAC at the market
— Set stop-loss at $ 16.40
— Set initial price target at $ 18.10 for a potential 7% gain in eight weeks
Citigroup, as mentioned, started from a very low perch. Investors who held the stock throughout the financial crisis hoping for a recovery with the rest of the market were sorely disappointed.
Still, the stock has moved up almost 20% from its January low to approach the top of a two-year trading range, which is also the top of its 2009-2014 base.
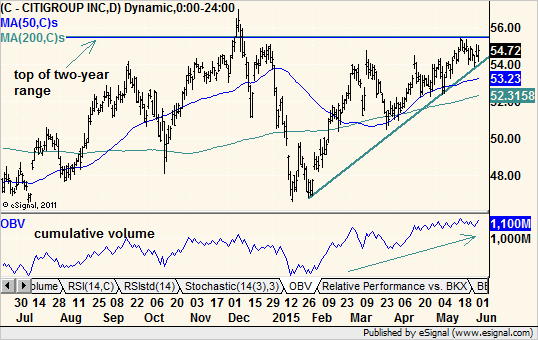
Both the short- and long-term trading ranges have ragged upper borders, so setting a specific buy trigger is tricky. However, C sports nicely rising cumulative volume this year to suggest demand for the stock is growing.
It will take a strong stomach to buy this stock as it still remains out of favor. It is not so hated anymore as to be a contrarian buy, but the market may have a hard time convincing the necessary waves of investors to jump back in without plenty of additional encouragement.
Note: My colleague, Amber Hestla, is also bullish on Citigroup, but rather than buying the stock outright, she used a strategy that could yield a 25% annual return on investment without ever paying a cent for the shares. All the stock has to do is stay above $ 50 per share. And if it falls below that level, she automatically gets to buy shares at a 9% discount to where they were when she entered the trade. It’s a win-win.
I realize that may sound a bit confusing, but she has put together an eight-minute tutorial that explains her strategy step by step, including how she’s closed 85 winning trades in a row. Watch it here.
On the breakout from the smaller range with the move above $ 55.50, we can project a gain of approximately the size of the range itself — 10 points. That doesn’t seem too out of reach considering it would still leave C at just over a 10% retracement of the 2007-2008 bear market.
Recommended Trade Setup:
— Buy C at the market
— Set stop-loss at $ 52.50
— Set initial price target at $ 65.50 for a potential 18% gain in 12 weeks


