
The Real Reason For the Oil Crash… And Why It Could Happen In Other Asset Classes
It looks like Oil’s bounce is over.
Traders have been playing for a rise in Oil based on two things:
1) Oil being sharply oversold due to its 60% collapse in the span of six months.
2) We’re heading into “drive season” (the summer) in which gas demand increases.
This has seen Oil surge 45% since its March 2015 bottom.
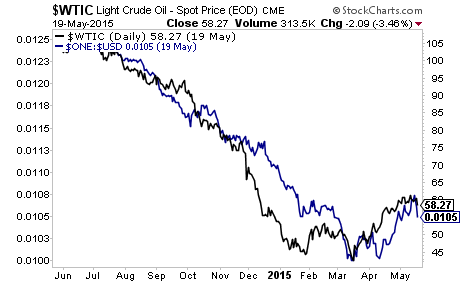
However, the larger story for Oil, like all things, concerns the US Dollar. Below is a chart showing Oil against an inverted chart of the US Dollar chart (so if the US Dollar strengthens, the blue line falls).
You can note the close correlation between the two:
It is not coincidence that Oil bottomed the very same day that the Us Dollar peaked and began to correct. Oil exploration is an extremely capital intensive business: drilling a new Oil well costs at a minimum ~$ 4 million… and can easily run up into the $ 100+ million range.
Unless it has a multi-billionaire for a backer… any Oil exploration company will issue debt to drill. This debt is denominated in US Dollars. When you borrow in US Dollars you are effectively shorting US Dollars.
When the US Dollar rally starting in July 2014 this forced the price of Oil down… which in turn made many new Oil projects uneconomical… which lead to Oil companies going bust and defaulting on their debt.
And so the US Dollar carry trade took down Oil.
With that in mind, consider the price of Oil against the recent strength in the US Dollar:
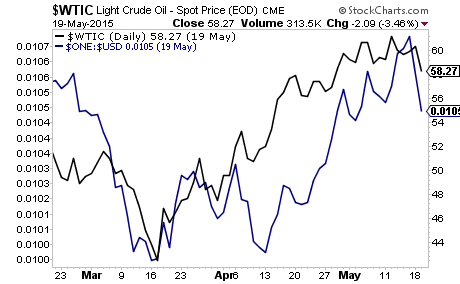
Oil has a ways to catch up… and if the US Dollar continues to strengthen, (remember the above chart for the US Dollar is inverted, so if the US Dollar strengthens, the blue line falls) Oil will collapse.
This is jut one small part of the massive $ 9 trillion in US Dollars that has been borrowed and invested elsewhere. To put this number into perspective, it’s larger than the economies of Germany and Japan combined.
The US Dollar bull market is not over… Indeed, if the US Dollar carry trade really begins to blow up… we could see another Crisis that would be even worse than 2008.
If you’ve yet to take action to prepare for this, we offer a FREE investment report called the Financial Crisis “Round Two” Survival Guide that outlines simple, easy to follow strategies you can use to not only protect your portfolio from it, but actually produce profits.
We are making 1,000 copies available for FREE the general public.
To pick up yours, swing by….
http://www.phoenixcapitalmarketing.com/roundtwo.html


