.facebook{ font-size: 13px; border-radius: 2px; margin-right: 4px; background: #2d5f9a; position: relative; display: inline-block; cursor: pointer; height: 41px; width: 134px; color: #FFF; line-height:41px; background: url(http://www.thetradingreport.com/wp-content/plugins/big-social-share-buttons/facebook.png) no-repeat 10px 12px #2D5F9A; padding-left: 35px; } .bssb-buttons > .twitter{ font-size: 13px; border-radius: 2px; margin-right: 7px; background: #00c3f3; position: relative; display: inline-block; cursor: pointer; height: 41px; width: 116px; color: #FFF; line-height:41px; background: url(http://www.thetradingreport.com/wp-content/plugins/big-social-share-buttons/twitter.png) no-repeat 10px 14px #00c3f3; padding-left:37px; } .bssb-buttons > .google { font-size: 13px; border-radius: 2px; margin-right: 7px; background: #eb4026; position: relative; display: inline-block; cursor: pointer; height: 41px; width: 116px; color: #FFF; line-height:41px; background: url(http://www.thetradingreport.com/wp-content/plugins/big-social-share-buttons/google.png) no-repeat 10px 11px #eb4026; padding-left:37px; } ]]>
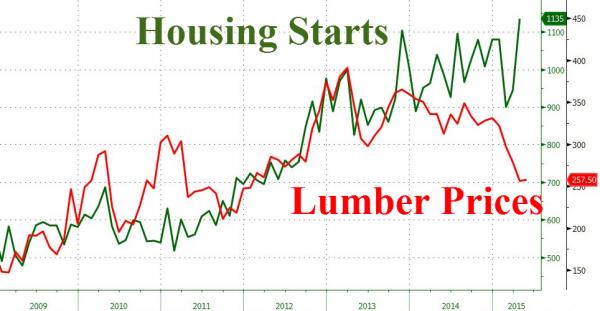
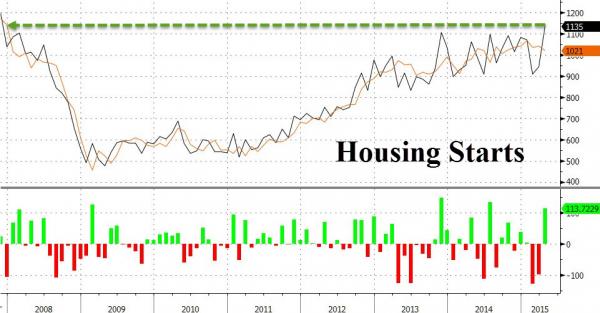
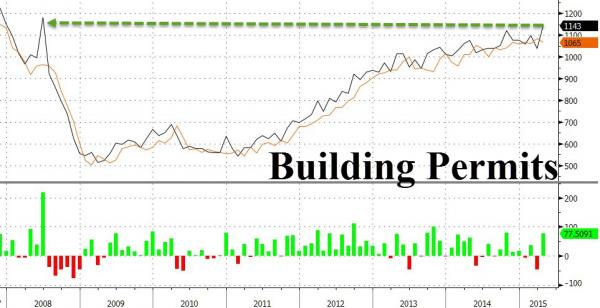
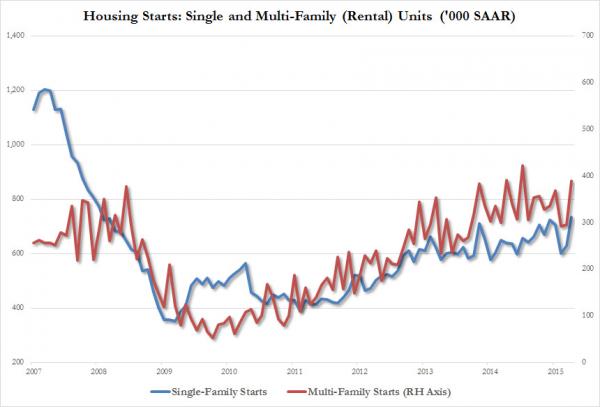
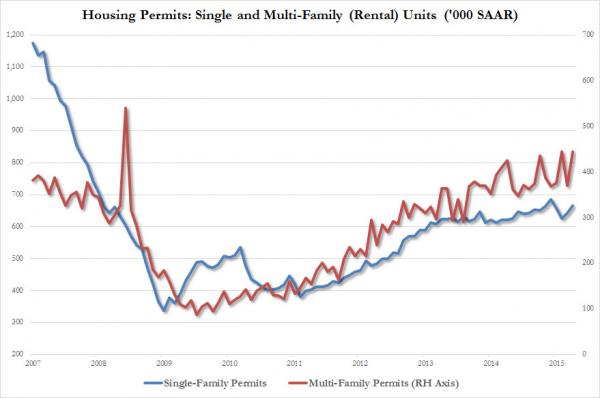
Following two ugly months of dramatically missed expectations, Housing Starts exploded to ‘recovery’ highs (highest since Nov 2007) jumping 20.2% MoM to 1.135million (against 1.015 exp.). This is the 2nd biggest MoM jump in history. Both single-family (3rd biggest MoM surge since the crisis peak) and multi-family starts surged. Permits also surged in April (jumping 10.1% MoM – the most since 2012) to 1.143 million (well above expectations) and the highest since June 2008. and Well these huge mal-investment spikes make perfect sense in light of the collapse in lumber prices (and thus demand).
Starts Soar:
Permits spike:
And the breakdown between single family (to own) and mult-family (to rent):
Starts:
And Permits:
Which all makes perfect sense:
