Don’t Be a Berkshire Hathaway Snob
Berkshire’s Buy-and-Hold Zealots: Missed Out
Buffett’s Performance has Lagged Since 2008
Many long-term holders of Berkshire Hathaway (BRK.a, BRK.b) take great pride in the fact they will never sell their shares. Buffett’s favorite holding period is “forever” so why should they feel any differently?
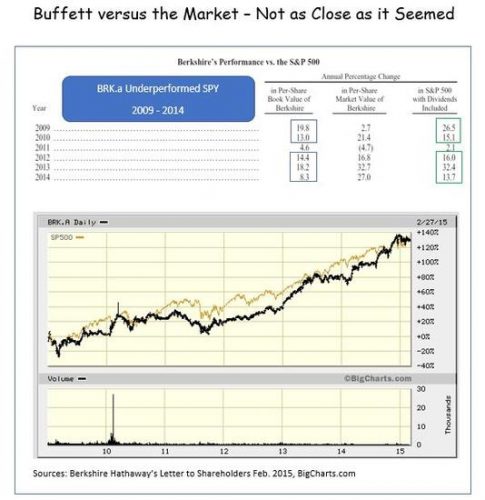
Warren Buffett (Trades, Portfolio) judges Berkshire’s performance by measuring the company’s growth in book value. On that basis the firm has trailed the S&P 500’s total return during five of the previous six years.

Berkshire’s stock price did better than the company’s growth in book value would have suggested. That is because Berkshire’s price to book value ratio expanded. The share price outshone the broad market during four of the six years since the end of 2008.
The chart shown below makes the race appear to be almost a dead heat. The period shown extends from Dec. 31, 2008 through Feb. 27, 2015. The final stats show the cumulative nominal movement of the S&P 500 ETF (SPY) was + 133.44% versus Berkshire Hathaway’s 128.96%.
That 3.47%, 6.2-year, edge is almost indiscernible to the naked eye.
Berkshire doesn’t pay dividends, though.
When you figure total return, the index outperformance is quite significant. The SPY’s total return through Friday, Feb. 27, 2015, was 177.61%, or 37.72% above Buffett’s, where nominal and total return are identical.
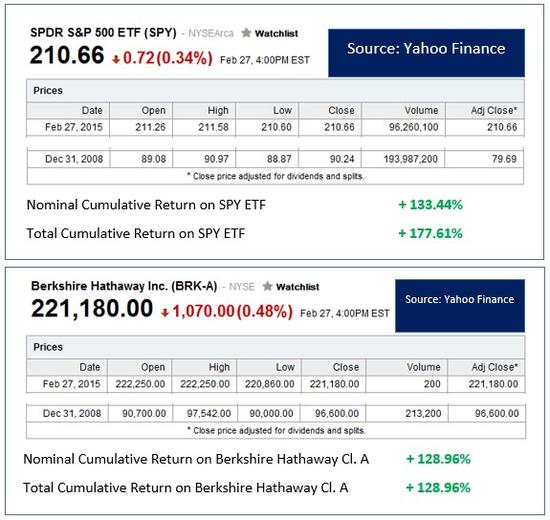
$ 100,000 invested in the SPY index ETF at the start of 2009 would be worth $ 37,720 more than that same buy-and-hold amount in Berkshire Hathaway. Those numbers say that bragging rights for stubborn Buffett fans are no longer in order.
Worse still, Berkshire Hathaway became more overpriced recently, based on its price to book value ratio, than it had been since early in 2008. The mid-January level was 1.43x Berkshire’s estimated year-end 2015 BV projection.
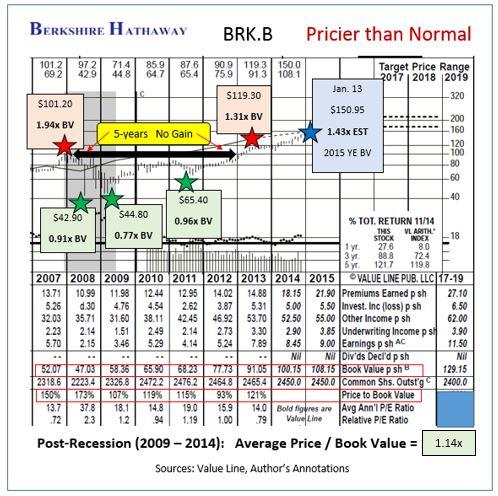
It’s not surprising that the stock (Class B shares) retreated after peaking at $ 152.94 to close last week at $ 147.56. That pullback occurred while the indices continued upwards on their path to new all-time highs.
A regression to a, still-above-normal, 25% premium to book value suggests risk down to the $ 135 area by December 31, 2015.
The stock’s low beta (0.75) might be heartwarming to those thinking the overall market might pull back a bit.
In non-taxable accounts, however, owners of Berkshire (Class B) might be better off simply selling out with an eye towards repurchasing at least $ 10 – $ 25 per share cheaper.
Berkshire Hathaway is not as overpriced as it was at the peak of the last cycle. Folks who didn’t exit the stock in late 2007, though, when it broke above $ 100, had to wait five full, dividend-devoid, years just to get even.
There is more risk than potential reward from today’s quote.


