
| Symbol | Last | Change | % | High | Low |
|---|---|---|---|---|---|
| PALLADIUM | 1,274.50 | -35.30 | -2.70% | 1,308.50 | 1,271.00 |
| Open Last Trade : 10:06 | GMT Time : Thu Jul 23 2026 10:06 | ||||
Palladium : Intraday Live Chart
Palladium : Technical Signal Buy & Sell
| 5 Min Signal | 1 Hour Signal | 1 Day Signal |
|---|---|---|
| Sell | Buy | Buy |
Palladium : Moving Averages
| Period | MA 20 | MA 50 | MA 100 |
|---|---|---|---|
| 5 Minutes | 1215.00 | 1234.06 | 1267.76 |
| 1 Hour | 1299.95 | 1296.01 | 1277.07 |
| 1 Day | 1268.95 | 1239.47 | 1361.98 |
| 1 Week | 1438.83 | 1463.96 | 1237.24 |
Palladium : Technical Resistance Level
| Resistance 1 - R1 | Resistance 2 - R2 | Resistance 3 - r3 |
|---|---|---|
| 1,296.83 | 1,300.50 | 1,302.33 |
Palladium : Technical Support Level
| Support 1 - S1 | Support 2 - S2 | Support 3 - S3 |
|---|---|---|
| 1,291.33 | 1,289.50 | 1,285.83 |
Palladium : Periodical High, Low & Average
| Period | High Change from Last | Low Change from Last | Average Change from Last |
|---|---|---|---|
| 1 Week | 1,295.00 -20.50 | 1,225.00 +49.50 | 1,262.07 +12.43 |
| 1 Month | 1,323.00 -48.50 | 1,165.00 +109.50 | 1,251.70 +22.80 |
| 3 Month | 1,568.00 -293.50 | 0.00 +1,274.50 | 1,332.25 -57.75 |
| 6 Month | 2,125.00 -850.50 | 0.00 +1,274.50 | 1,482.04 -207.54 |
| 1 Year | 2,129.00 -854.50 | 0.00 +1,274.50 | 1,457.20 -182.70 |
Palladium : Historical Chart
Group by:
Related News


About Palladium 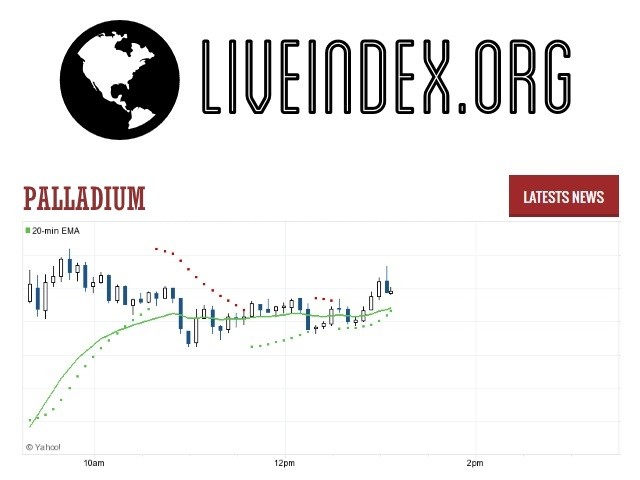
Palladium | Palladium Prices | Palladium Live Quotes | Palladium Prices in US Dollar | Palladium Live Quotes
Live Price of Palladium. Palladium Live Chart, Intraday & Historical Chart. Palladium Buy & Sell Signal and News & Videos, Palladium Averages, Returns & Historical Data
» Palladium
» Palladium Real Time Quotes
» Palladium Live Chart
» Palladium Intraday Chart
» Palladium Historical Chart
» Palladium Buy Sell Signal
» Palladium News
» Palladium Videos
» Palladium Averages
» Palladium Currency Pair
» Palladium Historical Data