
| Symbol | Last | Change | % | High | Low |
|---|---|---|---|---|---|
| IPC – MEXICO | 66,383.3 | +117.3 | +0.18% | 66,748.1 | 65,759.9 |
| Close | Mexico Time : Sat Jul 25 2026 01:34 | ||||
IPC : Intraday Live Chart
IPC : Technical Signal Buy & Sell
| 5 Min Signal | 1 Hour Signal | 1 Day Signal |
|---|---|---|
| Sell | Sell |
IPC : Moving Averages
| Period | MA 20 | MA 50 | MA 100 |
|---|---|---|---|
| 5 Minutes | |||
| 1 Hour | 66377.22 | 66605.86 | 66669.08 |
| 1 Day | 66590.62 | 66914.71 | 67904.97 |
| 1 Week | 68137.51 | 65330.34 | 59367.60 |
IPC : Technical Resistance Level
| Resistance 1 - R1 | Resistance 2 - R2 | Resistance 3 - r3 |
|---|---|---|
| 66,772.2 | 67,278.4 | 67,760.4 |
IPC : Technical Support Level
| Support 1 - S1 | Support 2 - S2 | Support 3 - S3 |
|---|---|---|
| 65,784.0 | 65,302.0 | 64,795.8 |
IPC : Periodical High, Low & Average
| Period | High Change from Last | Low Change from Last | Average Change from Last |
|---|---|---|---|
| 1 Week | 67,656.3 -1,273.0 | 65,759.9 +623.4 | 66,579.7 -196.4 |
| 1 Month | 68,044.7 -1,661.4 | 65,759.9 +623.4 | 66,782.8 -399.5 |
| 3 Month | 70,890.1 -4,506.8 | 64,666.2 +1,717.1 | 67,682.3 -1,299.0 |
| 6 Month | 72,111.4 -5,728.1 | 63,781.2 +2,602.1 | 68,373.1 -1,989.8 |
| 1 Year | 72,111.4 -5,728.1 | 56,486.9 +9,896.4 | 65,134.3 +1,249.0 |
IPC : Historical Chart
Group by:
Related News


About IPC – Mexico 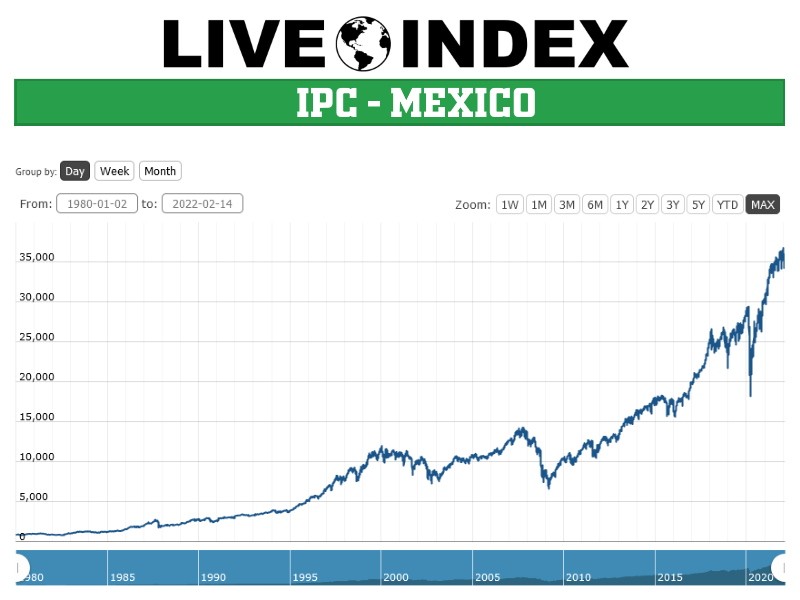
The Índice de Precios y Cotizaciones (IPC) is an index of 35 stocks that trade on the Bolsa Mexicana de Valores.
IPC Bolsa - IPC Bolsa Index | IPC Bolsa Live Quotes | Mexico Index
Live Price of IPC Bolsa. IPC Bolsa Live Chart, IPC Bolsa Intraday & Historical Live Chart. IPC Bolsa Buy Sell Signal, IPC Bolsa News, IPC Bolsa Videos, IPC Bolsa Averages, Returns & Historical Data
» IPC Bolsa
» IPC Bolsa Real Time Quotes
» IPC Bolsa Live Chart
» IPC Bolsa Intraday Chart
» IPC Bolsa Historical Chart
» IPC Bolsa Buy Sell Signal
» IPC Bolsa News
» IPC Bolsa Videos
» IPC Bolsa Averages
» IPC Bolsa Returns
» IPC Bolsa Historical Data