
| Symbol | Last | Change | % | High | Low |
|---|---|---|---|---|---|
| COPPER | 5.3020 | -0.1670 | -3.05% | 5.5650 | 5.2710 |
| Close | GMT Time : Sat Mar 21 2026 07:45 | ||||
Copper : Intraday Live Chart
Copper : Technical Signal Buy & Sell
| 5 Min Signal | 1 Hour Signal | 1 Day Signal |
|---|---|---|
| Sell | Sell | Sell |
Copper : Moving Averages
| Period | MA 20 | MA 50 | MA 100 |
|---|---|---|---|
| 5 Minutes | 5.33 | 5.34 | 5.34 |
| 1 Hour | 5.61 | 5.75 | 5.81 |
| 1 Day | 5.85 | 5.87 | 5.78 |
| 1 Week | 5.56 | 5.13 | 4.78 |
Copper : Technical Resistance Level
| Resistance 1 - R1 | Resistance 2 - R2 | Resistance 3 - r3 |
|---|---|---|
| 5.6363 | 5.8190 | 5.9303 |
Copper : Technical Support Level
| Support 1 - S1 | Support 2 - S2 | Support 3 - S3 |
|---|---|---|
| 5.3423 | 5.2310 | 5.0483 |
Copper : Periodical High, Low & Average
| Period | High Change from Last | Low Change from Last | Average Change from Last |
|---|---|---|---|
| 1 Week | 5.7785 -0.4765 | 5.2710 +0.0310 | 5.5650 -0.2630 |
| 1 Month | 6.1410 -0.8390 | 5.2710 +0.0310 | 5.8509 -0.5489 |
| 3 Month | 6.3870 -1.0850 | 5.2710 +0.0310 | 5.8488 -0.5468 |
| 6 Month | 6.3870 -1.0850 | 4.5565 +0.7455 | 5.4565 -0.1545 |
| 1 Year | 6.3870 -1.0850 | 4.0300 +1.2720 | 5.1272 +0.1748 |
Copper : Historical Chart
Group by:
Related News


About Copper 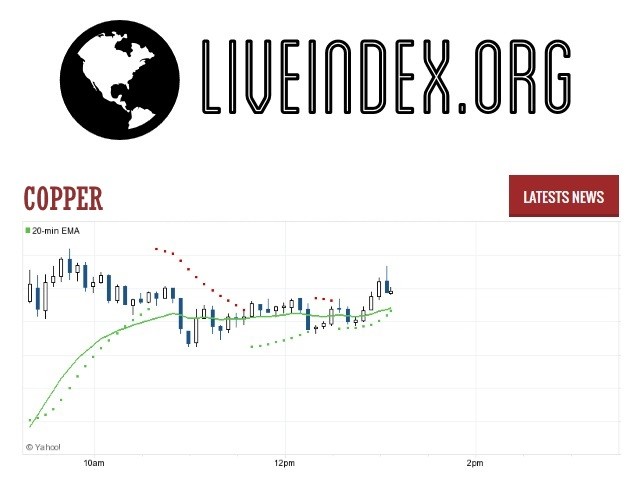
Copper | Copper Prices | Copper Live Quotes | Copper Prices in US Dollar | Copper Live Quotes
Live Price of Copper. Copper Live Chart, Intraday & Historical Chart. Copper Buy & Sell Signal and News & Videos, Copper Averages, Returns & Historical Data
» Copper
» Copper Real Time Quotes
» Copper Live Chart
» Copper Intraday Chart
» Copper Historical Chart
» Copper Buy Sell Signal
» Copper News
» Copper Videos
» Copper Averages
» Copper Currency Pair
» Copper Historical Data