What you should expect from Gold in the short term

But things don’t look so bullish to me…
First, the “smart money” is still short a record number of gold futures contracts. Back in July, I pointed out that commercial traders – the so-called “smart money” – were short more than 300,000 gold futures contracts.
That was the largest short position of the past 20 years. And it suggested we’d see at least a pause in gold’s run higher. At the time, gold traded for $ 1,330 per ounce. It’s around the same level today. And the commercial traders are still short more than 300,000 gold futures contracts. The commercial traders remain bearish on gold. It’s usually not a profitable move to bet against the smart money.
Second, the technical setup for gold is bearish today.
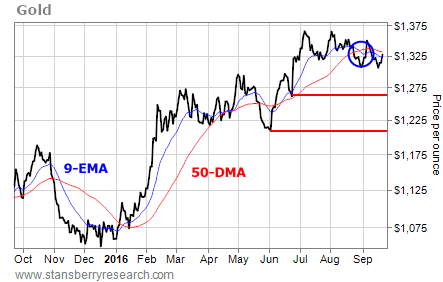
Take a look at this one-year chart posted above of the spot price for gold…
In late August, gold’s nine-day exponential moving average (EMA) – the blue line on the chart – crossed below its 50-day moving average (DMA) – the red line on the chart. This “bearish cross” often leads to an intermediate period of weakness.
Even after gold’s move higher Wednesday following the Federal Reserve’s decision to keep interest rates the same for now, it remains below its 50-DMA.
While gold hasn’t broken down, and the pullback from the highs has been minor, it’s tough to make a bullish argument from this chart. Gold needs to rally above its 50-DMA, and the nine-day EMA needs to cross back over the 50-DMA before the chart will turn bullish.
It looks like gold is more likely to head to one of the lower support lines on the chart. If gold drops toward $ 1,260 per ounce – or perhaps down to $ 1,210 per ounce – we can look to see if the commercial traders have lightened up on their short positions.
Then we might have an argument for adding more exposure to gold. Right now, though, expect gold to head lower in the short term.

