One major signal that Oil is back
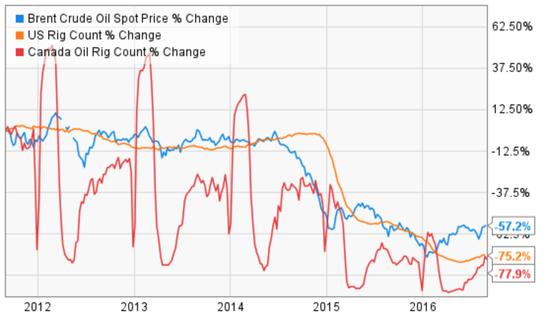
Year-to-date, oil prices have exploded higher by roughly 35%, with Brent prices hitting $ 50 a barrel.
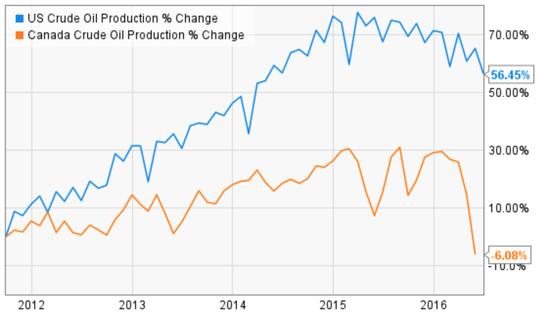
A big reason for the jump is the curbing of North American production, impacted heavily by lower U.S. and Canadian output. U.S. production started to taper off back in 2015, but it has taken until this year for Canadian output to follow suit.

The drop in oil prices starting in 2014 stemmed mainly from a North American supply glut. Fracking caused shale oil extraction to explode, allowing the U.S. to double its domestic oil production from 2007 to 2015. Rising domestic ouput allowed for foreign imports to fall by more than 50% from their high of 12 million barrels a day in 2005.
Because the U.S. is the world’s largest oil consumer, lower imports caused global producers like Saudi Arabia to drop prices. To make matters worse, dozens of projects that were initiated when oil was above $ 100 a barrel were still being completed. These developments, along with suprisingly low costs of shale production, allowed the supply glut to persist for longer than most analysts predicted.
Over the past five years, low prices have sent rig counts for both the U.S. and Canada lower by roughly 75%. While many have called for this to limit oversupply, it hasn’t been reflected in output reports in recent quarters.

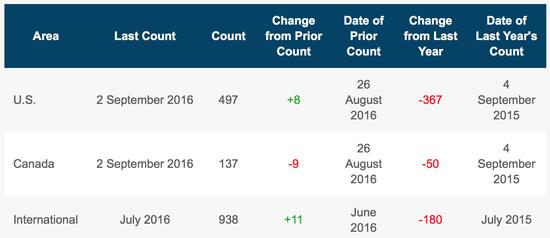
The total rig count in the U.S. is still down 43% from a year ago (oil down 38.5% and gas down 56.4%), but a recent report from Baker Hughes (NYSE:BHI) bodes well for the health of the energy sector.
On Sept. 2, Baker Hughes reported that overall U.S. rigs climbed to 497 from the previous week’s count of 489. Oil rigs gained by 1 to 407, while gas rigs climbed by 7 to 88. Canada still saw a decrease in rig count, but as a whole, the international community added 11 rigs. The statistics still have plenty of room to go before hitting historically norms, but the new data is one of the only signs investors have received recently that the oil and gas sector is truly stabilizing.


