The Most Dangerous Stocks In The Market Today

Between May and October, the stock market tends to perform one-fifth as well as it does in the other half of the year.
On top of that, we are about to enter the worst earnings season since 2009. Expectations for first-quarter earnings in the S&P 500 are an abysmal 9.1% lower than they were in Q1 2015. For the entirety of 2015, we saw earnings decline a total of 3.5%.
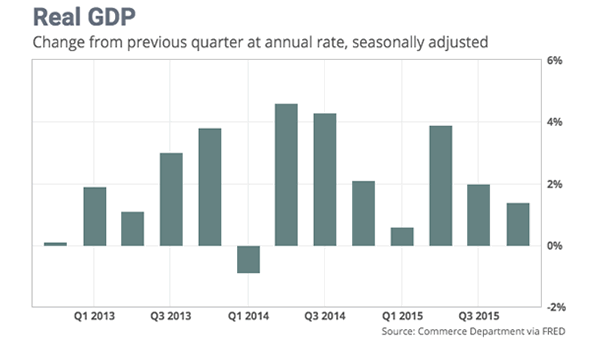
The U.S. economy isn’t looking so hot either. GDP growth in the final quarter of 2015 was the worst we’ve seen since the Great Recession, and economists are expecting a very weak 2.5% rebound in the second quarter. There’s also no catalyst for a rise in long-term growth either.

All these factors make for a very likely case that the “Sell in May and go away” phenomenon is likely to hold in 2016, just as it did last year when the S&P dropped 8.3% between June and October. And by the way, earnings and the economy looked way better this time last year than they do currently.
So, if the best and biggest stocks are likely to see a pullback and are already seeing their earnings evaporate quicker than mist in the Mohave, what about the small-cap companies? What can we expect from the companies that are often shunned in stressful times?
Unfortunately, they share the same destiny… only with a more volatile twist.
Why Sell Small Caps?
Small-cap companies have market capitalizations of $ 200 million to $ 2 billion. Many are the local companies that feed our economy and do a large part of the hiring. In 2012, 99.7% of small businesses had less than 500 workers, and nearly 90% of these small businesses had fewer than 20, but they account for nearly half of our GDP and were responsible for 63% of new jobs created between 2003 and 2013.
While small companies can be great incubators and job creators, they are also extremely sensitive to changes in domestic economic conditions. Unlike the blue-chip companies that make up the S&P 500, which generate nearly 50% of their revenue from foreign sources, the majority of small-cap revenue is derived here in the United States. This makes the group highly sensitive to economic fluctuations and real consumer health. As such, pros often treat small-cap stocks like the canary in the coal mine.
Small-cap companies are also more likely to be in their growth stage with volatile earnings patterns, making them even less attractive for the majority of pension and mutual funds that seek stable appreciation.
That’s important because individuals have very different investing styles than major institutions. When big funds sense problems on the horizon, they tend to hold on to their blue-chip stocks, while smaller investors and money managers will move out of their small-cap holdings.
These companies tend to be less stable and have much higher risk than your typical large-cap company, with current trailing P/E multiples upwards of 35 times earnings — 46% higher than the S&P 500.
Ironically, small caps should actually be faring far better than the S&P 500 because they aren’t as dependent on global economies and exchange rates, which have both been eating away at S&P 500 earnings. Unfortunately, the Russell 2000 is also struggling to maintain any earnings growth, delivering flat earnings for 2015 and weak growth in the first quarter.
As the economy continues to slow, it’s these stocks on the front lines that feel it first. Since they are higher risk and don’t have the fortune of being largely held by institutions (who are less likely to panic sell), this group is doomed to suffer a worse fate than the S&P 500 during the “Sell in May” period.
This isn’t just my own hypothesis. It’s been proven over the past 20 years that this group moves at about 122% of the S&P 500. This volatile behavior was evident last year when small caps lost nearly 3% from mid-April to mid-May, and then dropped nearly 13% from the June 2015 highs to the October lows.
Statistics point to a repeat performance this year.
The Riskiest of the Risky…
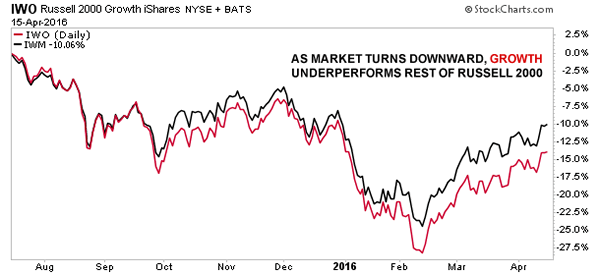
Just like the broader market, small caps are divided into value, income and growth categories. Of those, growth stocks, which are represented by the iShares Russell 2000 Growth (NYSE:IWO), carry the highest risk.
While growth stocks can outperform when the economy is booming and earnings are growing, they don’t hold up well in market declines, as you can see in the chart below.

This is because growth stocks are generally more expensive and don’t pay dividends, traits that make them less desirable in a flat, bearish or weakening market environment.
On the technical side, IWO is currently showing a lack of support with a strong bias to the downside. While the major indices were moving back into positive territory for the year, IWO hit massive resistance and failed to break through
Now, shorting the ETF is one way to capitalize on this bearish opportunity, but it’s not what I would do. For starters, the index is pricey, and if things don’t go your way, you could face huge losses.
That’s why I always opt for put options in these situations. Buying put options not only drastically reduces the cost of your investment, but it can help you leverage small stock moves into much larger gains, often in a very short period of time.
Consider this: Since I began my Profit Amplifier service one year ago, the average put option trade has been open for just 26 days and returned an annualized gain of 828%. And, on average, the maximum amount we had at risk on a trade was $ 712.
If you’ve ever considered using options, my strategy may be of interest to you. I use it to trade both put and call options, allowing me to make money whether stocks go up or down. I actually developed it when I was 16, and by the time I was 18, I was making $ 600,000 a year with it.
I’ve honed it over the years, and it went on to make me millions. But after a life-altering event, I decided to leave Wall Street and start sharing it with average traders.
If you’re interested in learning how it works or getting specific trade recommendations, follow this link.

