My No. 1 Retail Trade

If there is one sector that demonstrates how big stocks can overshadow the performance of the masses, it is retail. With behemoths such as Home Depot (NYSE: HD) and Amazon.com (NASDAQ:AMZN) leading the way higher, retail benchmarks like the Market Vectors Retail ETF (NYSE: RTH) are holding up fairly well.
But a look at somewhat smaller retailers such as Macy’s (NYSE: M) and Best Buy (NYSE: BBY) paints an entirely different picture. The typical retail stock is in serious decline.
While simply following the trend in falling stocks should lead to profits, I scanned the sector for stocks that are not quite as far along in their declines. Stocks in weak groups that are just starting to break down have more room to fall.
The one I like best is L Brands (NYSE: LB), which sells women’s apparel and beauty and personal care products through Victoria’s Secret and Bath & Body Works stores.

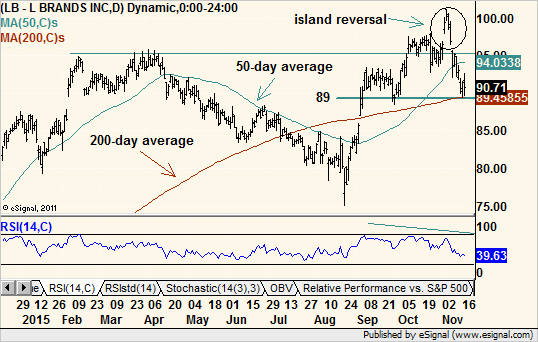
LB outperformed the market coming off the late-August lows. In the process, it moved above resistance set by highs from earlier this year.
The October breakout was tentative, but on Nov. 2, the company raised its guidance for the third quarter. The resultant jump in the stock the next day was cheered by the bulls and certainly looked to confirm the breakout.
But two days later, shares started to drop, and on Nov. 9, they fell back down through their previous breakout level.
The jump higher looked to be a breakaway gap, where price leaves a gap on the chart where no trading took place. It is usually a powerful and reliable signal that a new trend has started.
However, an equally powerful signal flashed as the stock gapped back down. The combination of the two gaps left an “island reversal” on the chart. This pattern derives its name from the fact that several days of trading are left isolated from the rest between two gaps like an island surrounded by water is isolated from a land mass.
Stated another way, the bulls stampeded into the stock and then changed their minds and stampede back out. The change in mood was palpable, leaving a failed breakout in its wake. In charting, failed bullish signals often become bearish signals, and that seems to be the case here.
Momentum readings have turned from strong to weak. Cumulative volume has not fallen quite as much but has broken a small trendline to the downside. And relative performance versus the market is now clearly lagging.
LB has dropped below its 50-day moving average and is currently sitting on modest support at its 200-day moving average near $ 89. At the same price level, there is short-term support from a dip in September, so that is where a conservative sell signal will be.
The downside target would be in the vicinity of the long-term rising trendline drawn from the 2008 bottom. It is currently in the high $ 60s but should rise above $ 70 in a few weeks where it will approach support from the August low near $ 75.
At that point, support from the bottom of a one-year trading range would still be holding, and the overall rising multiyear trend would still be intact. Whether LB bounces or breaks from there remains to be seen, but traders stand to make double-digit profits in the meantime.
Recommended Trade Setup:
— Sell LB short at $ 89 or below
— Set stop-loss at $ 94
— Set initial price target at $ 75 for a potential 16% gain in eight weeks
Note: A 16% gain in a matter of weeks is certainly nothing to scoff at, but certain traders have made even bigger profits on falling stocks in a shorter amount of time:
— A 33.9% profit on Keurig Green Mountain (NASDAQ: GMCR) in 56 days
— A 40.4% profit on Yelp (NYSE: YELP) in 29 days
— A 30.4% profit on Wynn Resorts (NASDAQ: WYNN) in nine days
— A 40.5% profit on Dillard’s (NYSE: DDS) in seven days
— A 69% profit on Alibaba Group Holding (NYSE: BABA) in nine days
And each of these gains came on a significantly smaller drop in the underlying stock. Find out how you can do the same by clicking here.

