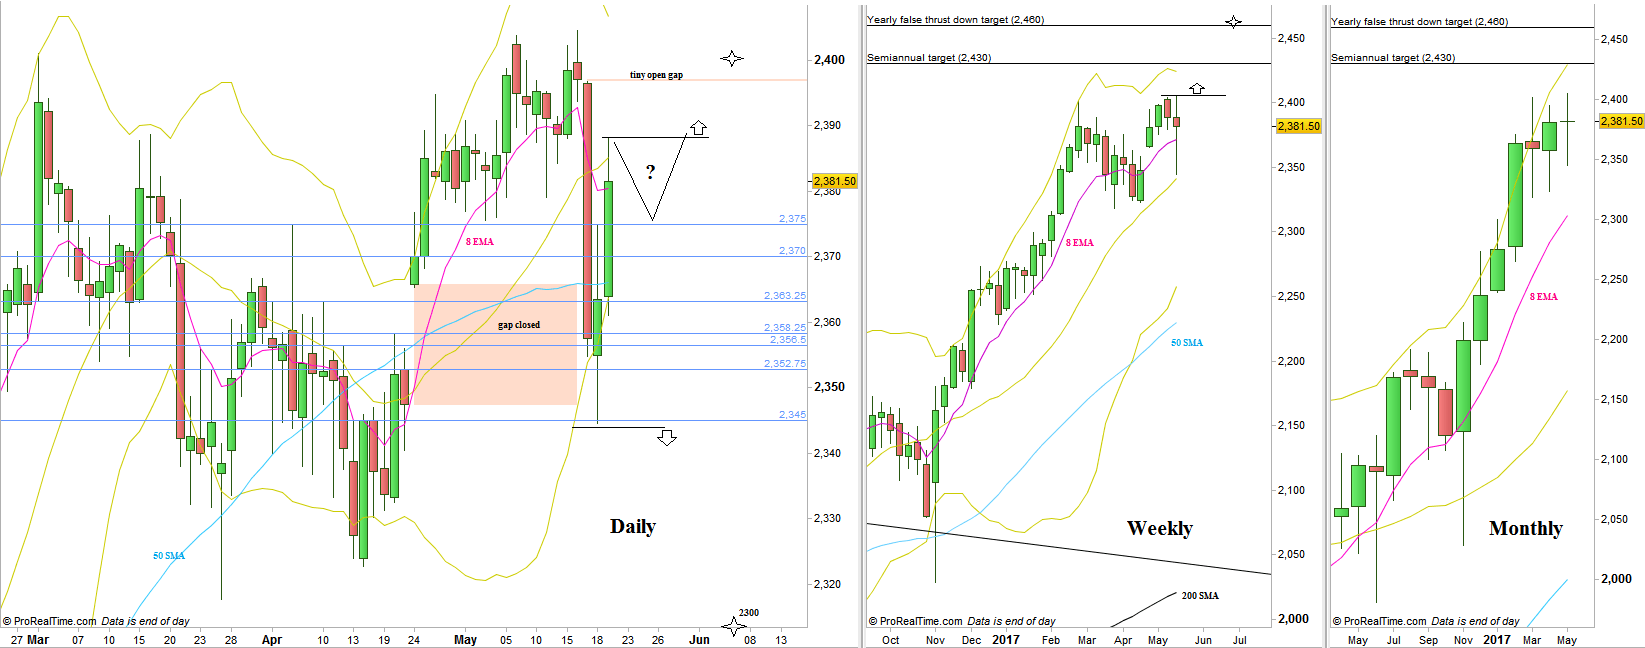
The passing week has brought some real volatility to the market, extending the current Monthly bar both to the upside and to the downside.
The week has started with an Upthrust (false thrust up turning into a reversal down), where Wednesday was the real change of behavior throughout the last couple of weeks, a strong bearish bar revealing some considerable supply. The Wednesday bar closed bearish below the Daily 50 SMA, but Thursday revealed that there isn’t any continuation to that momentum, except for closing the open gap below, and Friday took the price back into the previous range territory. Finally, the Weekly bar closed as a bullish Pinbar on sloping Weekly 8 EMA and 20 SMA, not good news for the bears.
Looking at the Monthly we see that the price had visited the midrange of last March Monthly bar (that formed a stopping action), as expected and mentioned in a past review.
Taking out the Weekly Low is a bearish setup to reach the 2300 area level, and making this whole price action of the last three month a Megaphone pattern, but I would give the least chances for that scenario.
Taking out the all time High once again on the coming week is a bullish setup to reach major targets, the year 2016 first half Semiannual bar which was a bullish Pinbar on sloping 8 EMA, at 2430, and the Yearly Spring model, target at 2460. It will be breaking a bullish Pinbar on sloping 8 EMA (and 20 SMA) targeting the same bar amplitude, at 2464.
Since the market has closed the gap at 2347.4-2365.25 I would give more chances for the coming week to stay in the current range.
An intra weekly setup can emerged from correcting at the beginning of the week while respecting the support at 2375 then making a follow through up, with an amplitude to close the tiny open gap above (2396.75-2397.1) closed to the all time High (see chart).

S&P Futures: Daily, Weekly and Monthly charts (at the courtesy of prorealtime.com)
Disclaimer: Anyone who takes action by this article does it at his own risk and understanding, and the writer won’t have any liability for any damages caused by this action.

