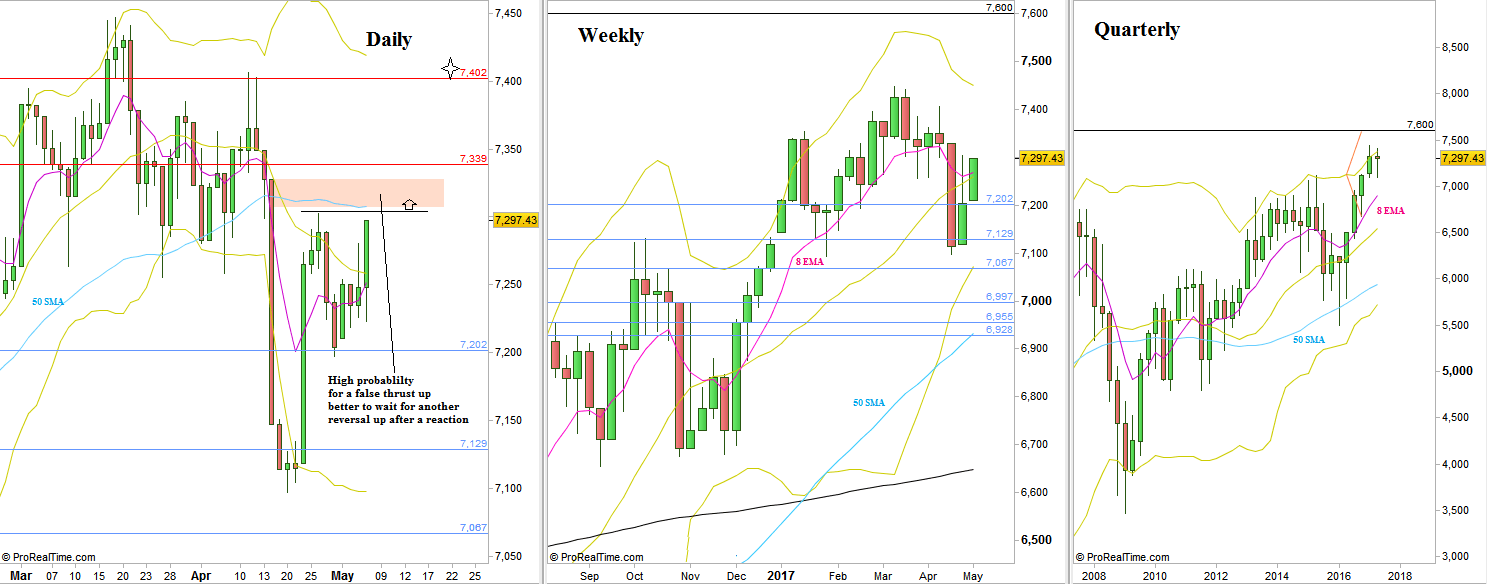
The passing shortened trading week was rather bullish, mainly thanks to last Friday, making a Spring (false thrust down turning into a reversal up), but the whole week ended as an inside bar that didn’t take out the previous Weekly High which was itself an inside bar as well.
Taking out previous inside Weekly bar High at 7302.5 is a bullish trigger to reach the 7410 level area, but the price action on the levels above 7302 raises the probability for an Upthrust (false thrust up turning into a reversal down) and some manipulation. In such cases it is better to wait for another reaction to end, joining the move only on renewing signs of strength.
If the level of 7410 is reached (meaning the Monthly High is taken out), then most probably the current Monthly reaction is over, and the market is on its way to the next major target at the 7600 levels, the target of the last quarter of 2016’s bullish Pinbar on sloping 8 EMA.
On the other hand, taking out the Weekly Low (neglecting inner bars) at 7096.8 is a bearish indication pointing at the 6870 level area as the target, a move that can further develop later on into the roots of the current bullish wave, inside the 17 Years of range, at 6680. This move down if happens wont be rapid and easy either, but most likely get interrupted by strong rally attempts that may even reverse the price action back to the long term uptrend.

FTSE100: Daily, Weekly and Quarterly charts (at the courtesy of prorealtime.com)
