The passing shortened trading week was basically a sideways action. The same modus operandi was being held throughout the 4 days: Open closed to the High then mostly a bearish sentiment throughout the rest of the day. Last Friday covered almost all of the Weekly range, by making an Upthrust first, then closing bearish on the 8 EMA short term sentiment line, but respecting the Daily Swing Low at 9270.
The way to look for renewal of the uptrend is probably going to be either by dealing the open gap below, showing signs of strength without closing it completely, or by a gap up and a bullish day that will reject the bearish sentiment of last Friday. Otherwise, closing the open gap below 9217.95-9250.85 completely is a clear sign of weakness and may develop into a deeper reaction, a test of the Monthly Low at 9075.
Let’s look at the wider picture as we haven’t done so for a pretty long time. The charts are taken at the Close of last April.
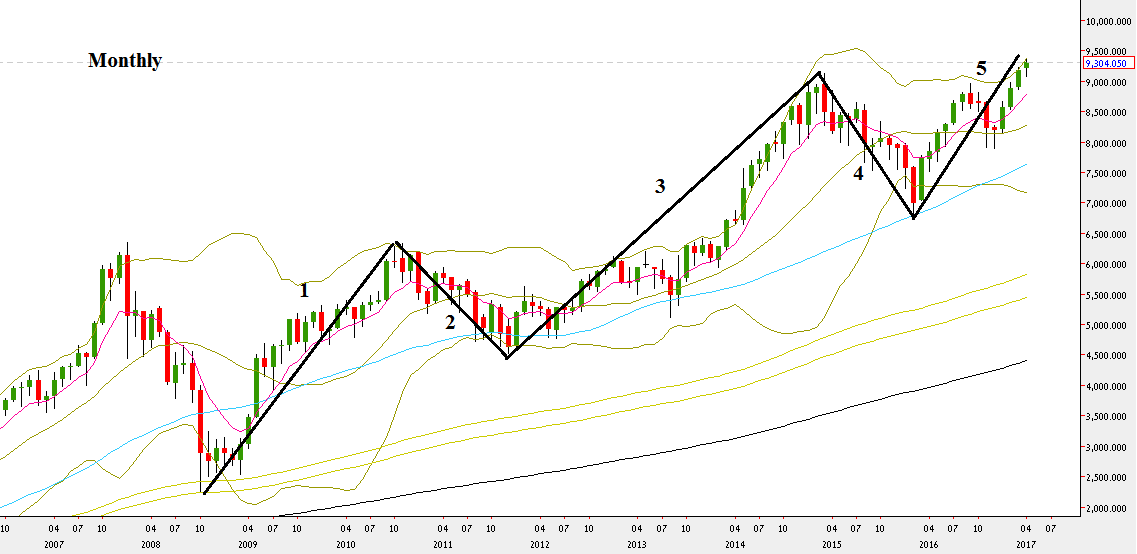
Since the beginning of the current Bullish market at the year 2009, a clear structure of Elliot waves is being observed clearly (chart1). We are probably at the 5th wave, usually the last wave of the whole structure. It is a classic Elliot Wave model as it is very clear to see that the corrective wave 4 doesn’t penetrate the range of wave 1, and Wave 3 is not the shortest wave among them all.

Nifty50 Monthly chart with the Elliot wave model (at the courtesy of netdania.com)
Looking closely at the last Monthly reaction (wave 4) and the bullish wave ever since (wave 5) we can see an inverted Head & Shoulder pattern, a bullish pattern. Once the market has made a follow through up, another important pattern has potentially emerged, the AB=CD pattern.
The target for both the Follow through break up and the AB=CD pattern are at the levels of 10040-10050.
