A bearish sentiment with recovery attempts on the passing week has caused the index to close a LL LH Weekly bar on middle, supported on the short term sentiment line, the 8 EMA. This price action calls for further consolidation inside the current Weekly range.
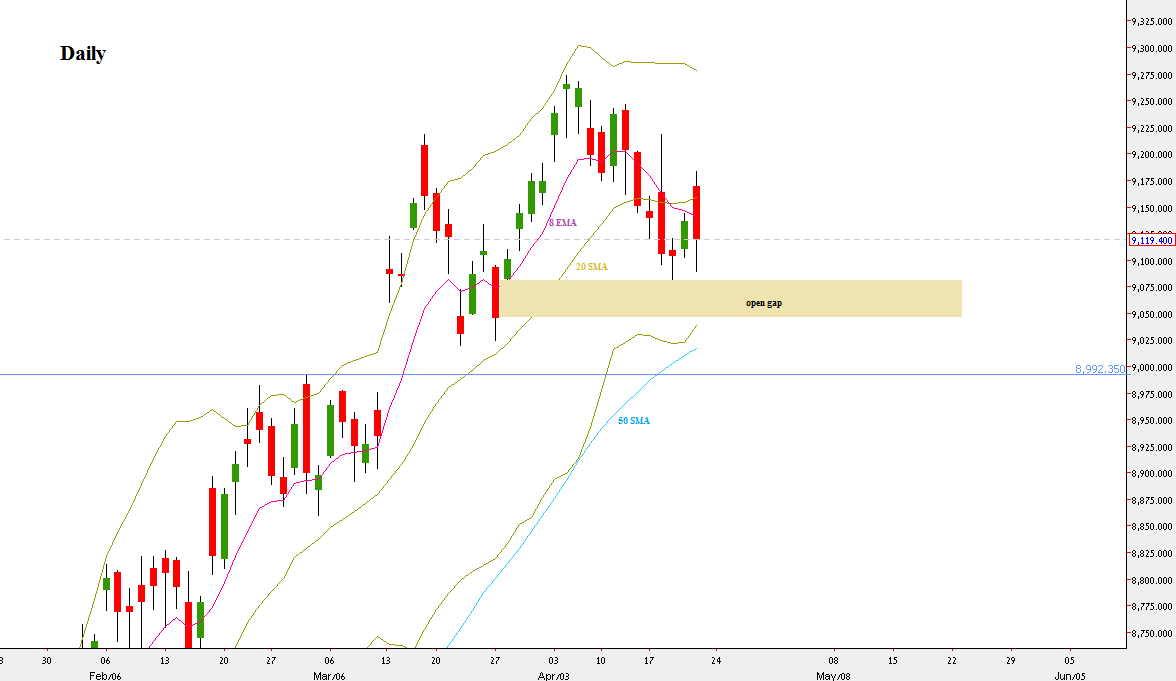
Two important Daily bars were recorded, the Daily Upthrust of last Tuesday, and the last trading Day on week. Both of them were bearish OKR (Outside Key Reversal). The fact that these two strong bars couldn’t cause the market to decline sharply , but stay in the current range – is an important sign of strength.
The market has tested and closed the gap between the levels 9100.8 and 9109.1, a gap that had a potential of being a runaway gap.
Below it, there is a more important open gap (kicker pattern). The kicker pattern appears when the market changes its sentiment by 180 degrees immediately between two bars. This is a clear support area where many unfilled orders are waiting to be filled as the last time the market had been there, the price left rapidly.
Any sign of strength followed by a reversal up without closing this gap completely is a good bullish signal. The strongest support in that area is at 9073.
We are still in a bullish setup of the Weekly bullish Pinbar 3 weeks ago to reach the level of 9365, and the Stop for that signal is below the Weekly Pinbar’s Low, at 9024.65.

NIFTY50, Daily bar
Disclaimer: Anyone who takes action by this article does it at his own risk, and the writer won’t have any liability for any damages caused by this action.
