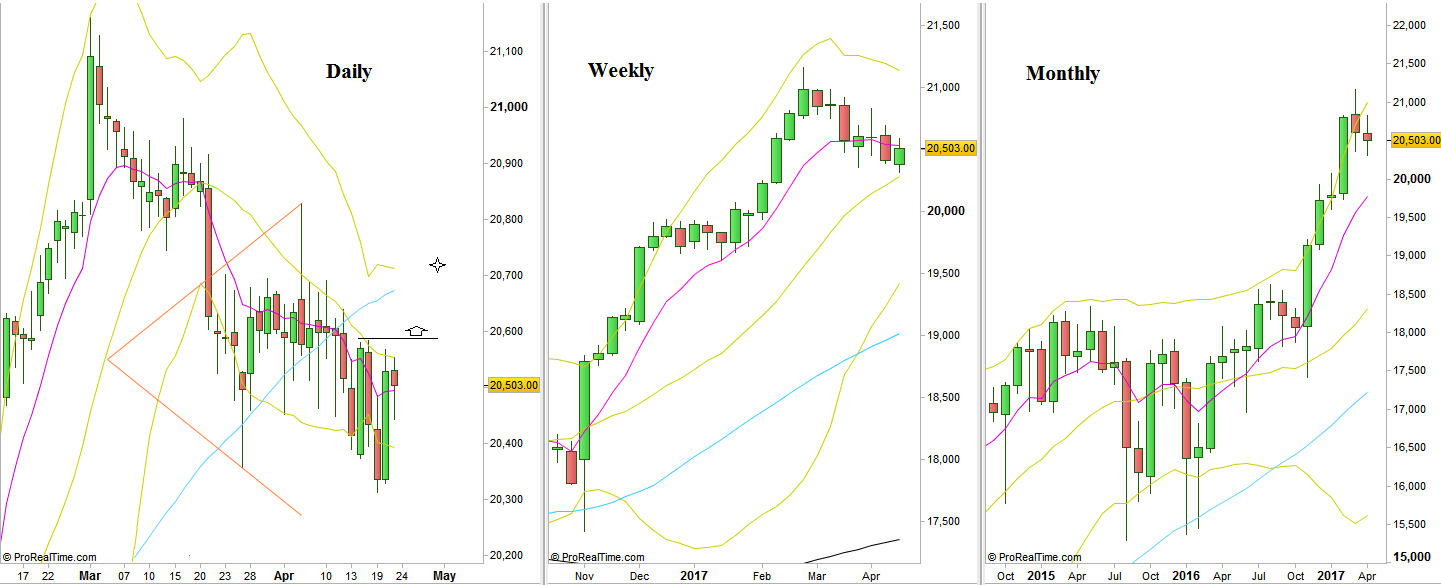
Over the passing week, the market has continued its shallow correction. The price action was pretty much the same as the previous weeks. Currently the Dow is the weakest index among the main US indices.
The important indication is the Monthly Low being taken out, but we should remember that it came after 5 consecutive months each one penetrating deeply the upper Bollinger band.
A Daily bearish setup is still in play pointing on 20280 as its target. It was the bearish Pinbar on sloping 20 SMA of April 5th. The other bearish setup mentioned on the last review has been negated on the passing week by taking out its High.
On the other side, taking out the Weekly High at 20584 is a bullish setup to reach the Daily 50 SMA and the Daily upper Bollinger band at the area levels of 20720, most likely the move is going to be rapidly within the same bullish momentum.

Dow Futures: Daily, Weekly and Monthly charts (at the courtesy of prorealtime.com)
