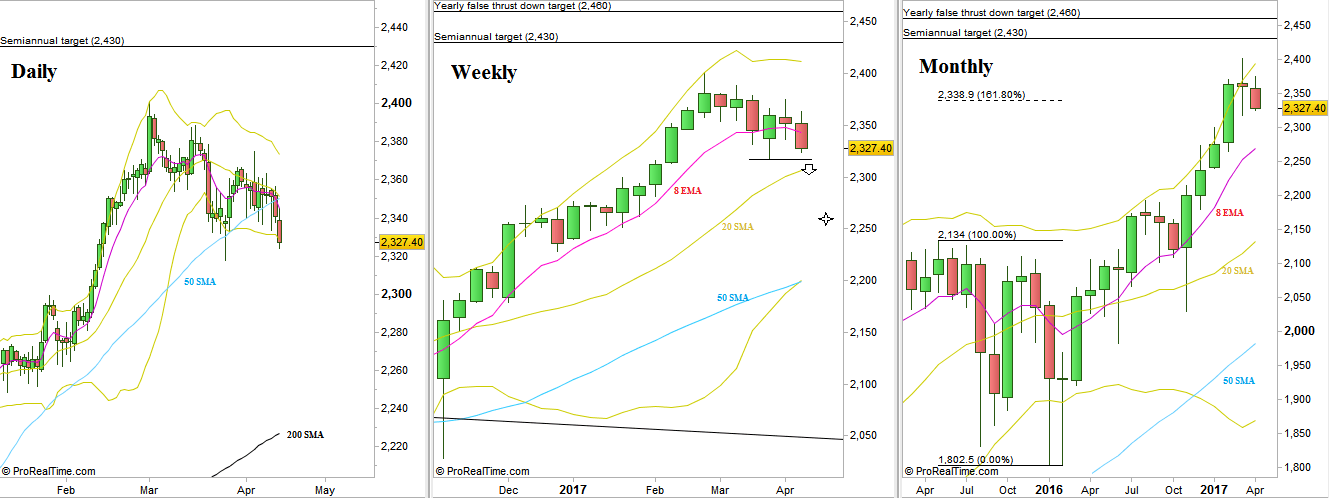
The tensed price action on the middle of the range (2350-2355) has brought more volatility and the Monthly bar has expanded to the downside. On the last trading day of the passing week, Thursday, the price has declined sharper and penetrating the Daily lower Bollinger band, what makes the chances for a V bottom to be quite slim. Therefore, it is very likely for the most bullish case to see the price spends couple of days on these levels rather than reversing up sharply within a day.
The signs of strength mentioned in the past reviews – the closing of the Daily bars above the Daily 50 SMA and the Weekly bars above the Weekly 8 EMA have been spoiled by the extension down.
Taking out the Monthly Low at 2317.75 is a bearish signal to reach the 2263 area, but this is not a qualitative signal currently, as the last bullish momentum was very high. In any case, if that is to happen eventually, then by most chances we shall see blips up that would give us better entries than selling the breakdown level with a Stop above the current Monthly high, at 2375.
Pay attention to an open gap lying closely below the Monthly Low 2312.75-2313.75 that can trigger a big correction up, and if stays open after reversing up, can yield even a new all time High.

S&P Futures: Daily, Weekly and Monthly timeframes (at the courtesy of prorealtime.com)
Disclaimer: Anyone who takes action by this article does it at his own risk and understanding, and the writer won’t have any liability for any damages caused by this action.

