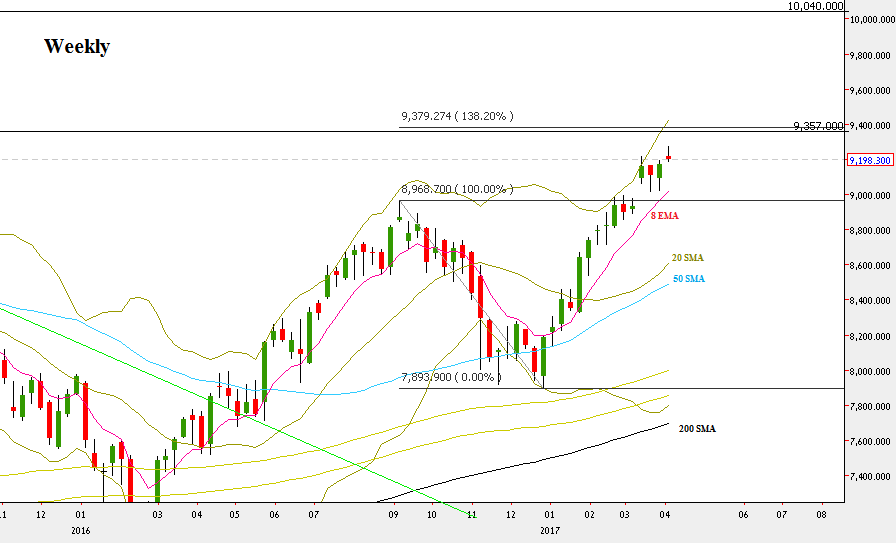
The passing week triggered the bullish signal of the two Pinbars mentioned in the last two reviews, and a new all time High has been recorded. It means also important indication for the longer term: a Monthly (and a Quarterly) HH.
Even though the week has started with a gap up, a correction made on the same first trading day almost reached the previous Weekly Pinbar’s High, and the fact that the market reversed up sharply from that point shows that many traders realized the opportunity to join the move at that point.
Friday somewhat spoiled the bullish sentiment, making the Weekly bar closing weak. But as long as the gap up below the Weekly bar is being preserved (even by a tick), the sentiment for the short term is bullish. The short term target is the last Weekly bullish Pinbar’s amplitude, at 9357, where the Monthly upper Bollinger band lies. It is also slightly below the 138.2% important extension of the whole Monthly correction since last September, at 9380.
On the other hand, closing the weekly gap 9173.75-9188.75 is a clear sign of weakness, and in case the market makes a follow-through down after bouncing, it probably is going to cause the price to test the Weekly gap below 8934.5-9019.5.
The market is still in a Monthly bullish follow through signal to reach the 10040 level, but the Stop for this move is still huge, the Monthly swing Low, below 7893.
Since the market is very stretched up, I would be cautious about maximizing the Weekly bullish Pinbar’s setup beyond the 1:1 basic target of the previous Weekly bullish Pinbar especially if that target is on the Monthly upper band.

NIFTY50, Weekly chart (at the courtesy of netdania.com)
Disclaimer: Anyone who takes action by this article does it at his own risk, and the writer won’t have any liability for any damages caused by this action.

