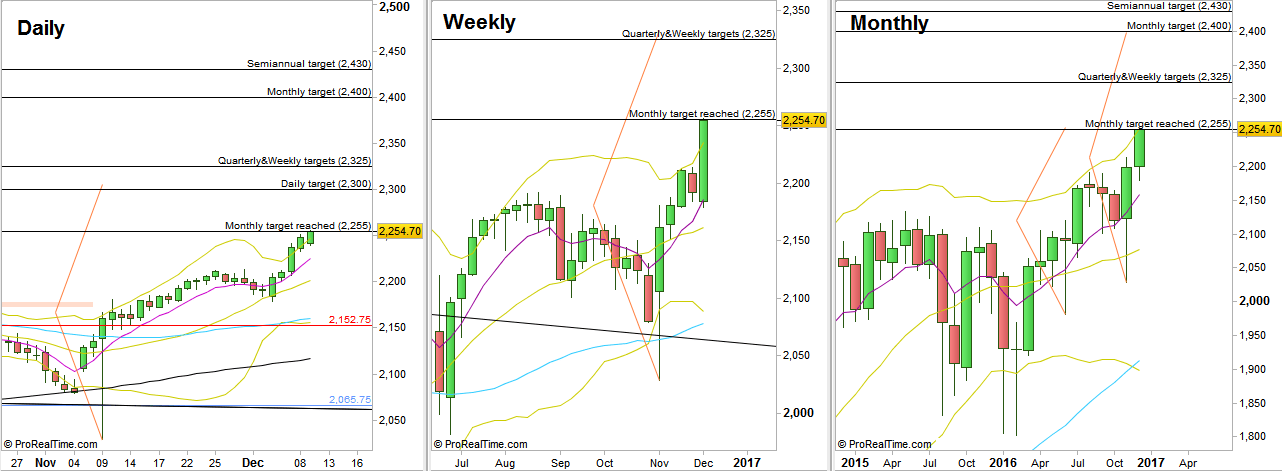
One of the most bullish weeks lately has passed. When the Monthly High was taken out on last Tuesday, there wasn’t any other choice but to look upwards, and the first target at 2248 that has already been achieved was of the same magnitude as the Low of the week and the High of the previous consolidation week.
Currently the most important bullish signal point towards the 2330 area, triggered by a thrust above the High of the bullish Weekly pinbar printed by the end of the election’s week. The Monthly bullish pinbar on sloping 8 EMA which was also an engulfing pattern is another major signal, target at 2400, currently also the level of the Quarterly upper Bollinger band.
Pay attention that we are exactly at the target level of the bullish Monthly pinbar of last June (the Brexit month). It is the same signal as the Quarterly bullish pinbar on sloping 8 EMA of the 2nd quarter, 2016. It can halt and delay the current strong momentum for a while, at least for the coming weeks. In addition, the fact that December is usually a consolidation month – should both be taken into account. In case of consolidation, the previous Monthly High at 2213.75 should serve as a strong support.

S&P Futures, Daily,Weekly and Monthly charts (at the courtesy of prorealtime.com)
Disclaimer: Anyone who takes action by this article does it at his own risk and understanding, and the writer won’t have any liability for any damages caused by this action.

