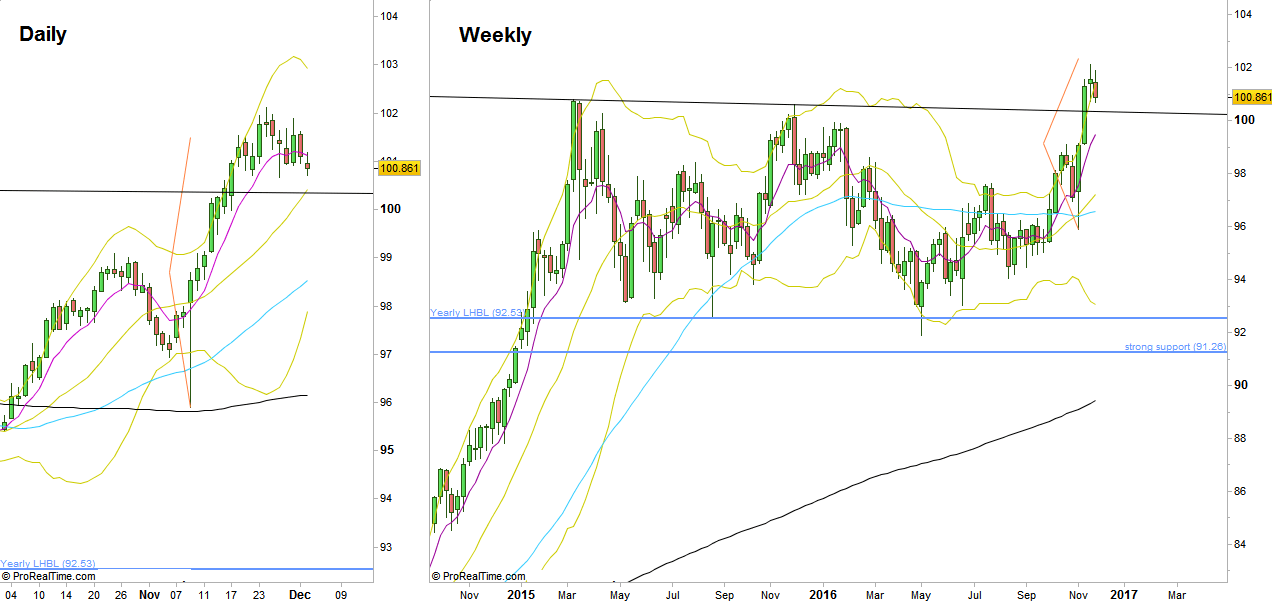
A consolidation week has passed, the Daily LLBH (Last Low Before High) at 100.71 was taken out, and taking out the Low of 100.675 is a bearish signal to reach the 99.6 level area. However, the current overall bullish momentum should warn us from taking any action to the downside on the Daily and above timeframes, at least not before another pullback up that fails eventually.
Another validation comes from looking at the Weekly timeframe where the last Weekly bar, although being a LL LH bar, penetrated deeply the upper Bollinger band, hence meaning a current strong bullish momentum up.
There are good chances to see the price declines a little further towards the Daily 20 SMA where an important support lies (100.5 approximately by Monday). This would be also probably a test back of the down trend line the market has already broken up by mid November (the trend line connecting the Quarterly Highs of the last 2 years).
So, a bullish opportunity on the Daily timeframe might rise from a false thrust down that touches the 100.5 area. In this case, we must wait for the Daily bar to end strong (e.g. a bullish pinbar), then a thrust above it on the next bar (day) is a good bullish signal to continue the bullish momentum.
On the other hand, if a break down doesn’t end up with a bullish pinbar or a bullish engulfing bar, it is a sign that a deeper reaction below the down trend line is developing and it might reach the 99.9 area level, where it is going to meet the Weekly 8 EMA.

The Dollar Index, Daily and Weekly timeframes (At t he courtesy of prorealtime.com)
Disclaimer: Anyone who takes action by this article does it at his own risk and understanding, and the writer won’t have any liability for any damages caused by this action.

