The bullish pinbar’s High of the previous week has been taken out by last Monday, but the thrust up was not strong enough, resulted in a Weekly pinbar again, this time a bearish one.
The Monthly bar of November ended bearish below the 8 EMA short term sentiment line.
The weakness in the Weekly chart is seen clearly by the fact that this is the fourth week to penetrate the lower Bollinger band, even closing below.
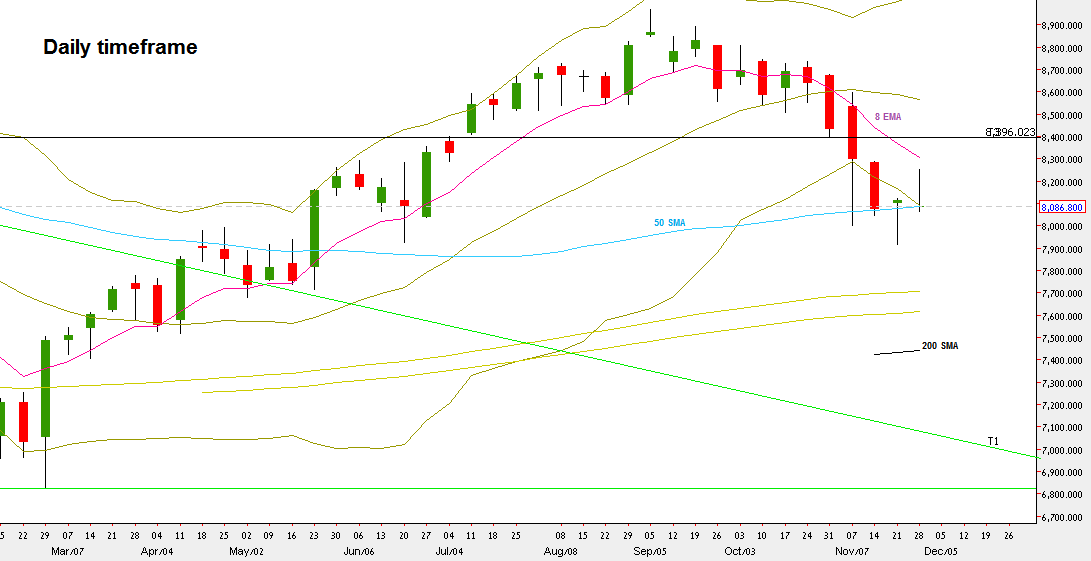
However, The Weekly bar closed on the 50 SMA, and the current price action calls for more sideways action on the large last two week’s range, and it looks like that the price is going to test again the Weekly High. There is still a bullish setup on the Weekly (Weekly bullish pinbar two weeks ago) to reach the 8330 area.
Before making any bullish swing decision on the Daily, wait for the price to close the Daily open gap above (8158.85-8192.9) first, to react down and then only by new signs of strength confirming a bullish action.
On the other side, taking out the Weekly Low at 8066.7 is bearish and can drive the market down towards the 7800 area. If such is the case, I would give more chances for a creeping decline that takes more than a week.

NIFTY Futures, Daily chart (at the courtesy of netdania.com)
Disclaimer: Anyone who takes action by this article does it at his own risk, and the writer won’t have any liability for any damages caused by this action.

