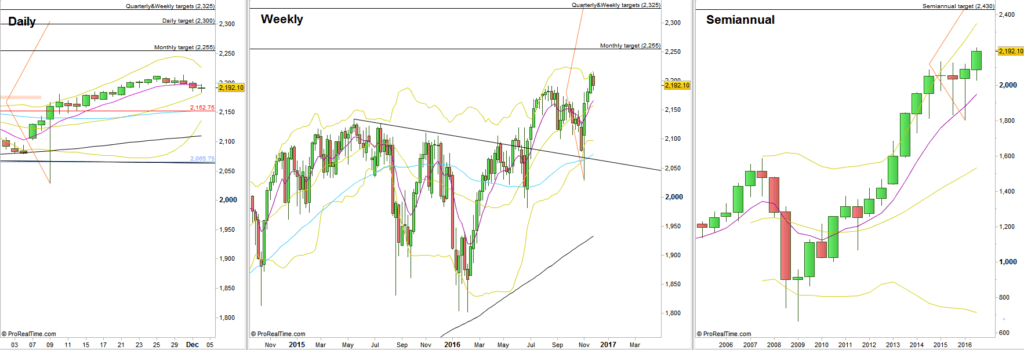
The Month of November ended up as a Monthly bullish pinbar on a sloping 8 EMA, very strong and bullish picture, but in order for this pattern to trigger, a new Monthly High should be made.
The Weekly status is less enthusiastic. The previous week didn’t manage to touch not to mention penetrate the upper Bollinger band, nor did the passing Weekly bar.
So goes the picture on the Daily, where the Daily bars didn’t manage to touch the upper Bollinger band since November 10th, and the bands are tightening signaling that most likely we’ll see further Weekly consolidation in the near term.
The Monthly High (also the all time High) at 2213.75 was recorded at the last day of November, as part of an upthrust (False thrust up after consolidation).
The current price action calls for further decline to the 2170 area and later may decline further towards 2150. That can happen in a creeping decline manner, i.e. prepare for more upthrusts, and sell it when their Low is being taken out.
However, in case the Monthly (and all time) High is taken out – the midterm picture becomes again very bullish. That of course would deny the above, and the near resistance is at 2222, the target of the Weekly bullish pinbar on a sloping 8 EMA to the upside three weeks ago.

S&P Futures, Daily, Weekly and Semiannual charts. (at the courtesy of prorealtime.com)
Again, as mentioned in the previous reviews, it is very interesting to see that for each important timeframe, from the Daily up to the Semiannual, all have at least one bullish signal by the form of bullish pinbar on a sloping 8 EMA or in the form of a false thrust down on the lower Bollinger band, with a considerable far target to the upside – all signals have already gotten the bullish trigger by taking out their highs. However, beware of the correct wide stop level for each signal (1:1).
By the table above, you can notice that most signals share common targets. More than that, since these are also targets of high timeframe signals, there are good chances for the whole bullish market to end by achieving most of these targets.
Disclaimer: Anyone who takes action by this article does it at his own risk and understanding, and the writer won’t have any liability for any damages caused by this action.

