The Dollar Index made another HH HL Weekly bar, penetrating deeply the upper Bollinger band, but with a clear shortening of the thrust. The Monthly bar that is going to close by Wednesday, has already penetrated its upper Bollinger band considerably, a very bullish picture.
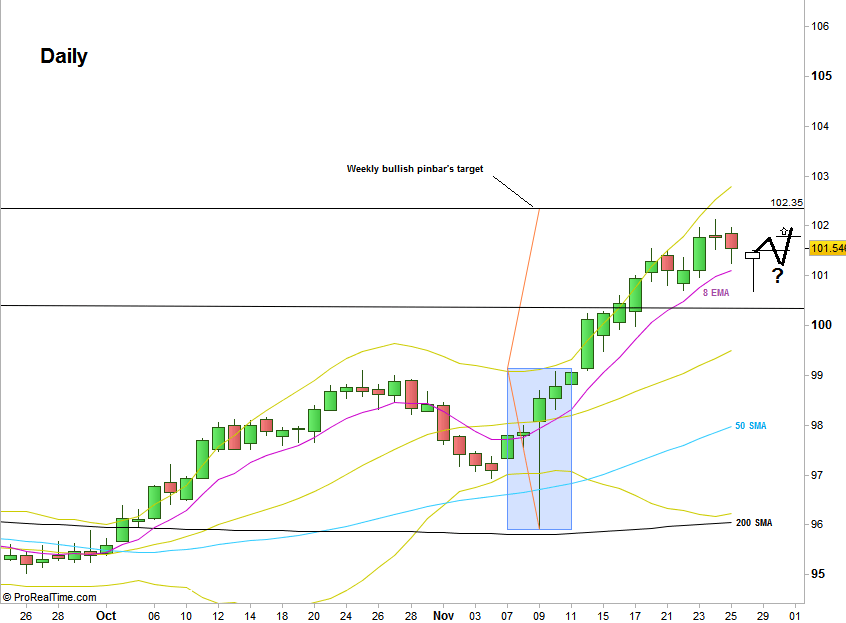
Pay attention that the last thrust up on last Wednesday and Thursday hasn’t reached the upper Bollinger band. Yet, closing all bars above a steep 8 EMA pointing upwards is a strong bullish momentum, and sure there is nothing to wait for as for the bearish side on the Daily and above timeframes.
A clear bullish target is right above, the 102.4 area, which is 1:1 magnitude target of the last Weekly bullish pinbar (the election’s week). So there is nothing to compromise in a bullish signal on the 4H and above, if it doesn’t point to that target.
Since the Dollar Index has already started the week with a thrust down below the last Daily swing Low at 100.71, a good bullish opportunity might rise from ending this Monday with a sign of strength (i.e. bullish pinbar) closing above the Daily 8 EMA, followed by a thrust above that pinbar, then a correction and a follow through. I would be certainly a good opportunity if this scenario is going to point on a 1:1 target closed to the Weekly bullish pinbar mentioned above, i.e. the 102.4 level (see chart).

Dollar Index, Daily chart (at the courtesy of prorealtime.com)
Disclaimer: Anyone who takes action by this article does it at his own risk and understanding, and the writer won’t have any liability for any damages caused by this action.

