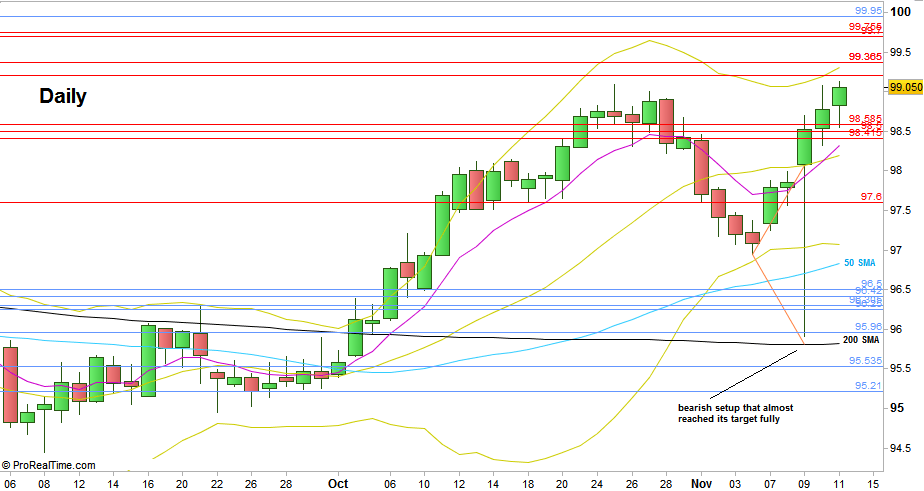
The long term untypical positive correlation between the Dollar and the US main stock markets that has been here most of the time for the last few years (as part of the QE manipulation) proved to be still valid throughout the passing election week. Just like the stock markets the Dollar Index has started the week with a daily bullish kicker pattern (bullish bar with a gap up following a bearish bar), and just like the stock markets, Wednesday brought a big shakeout decline formed as a huge false thrust down that tested the Daily 200 SMA below, finally closing as a bullish pinbar on sloping 8 EMA.
Like the SP500, there was here a Daily bearish setup to reach the pullback correction magnitude size, and you can see by the Daily chart that it has been reached almost fully.
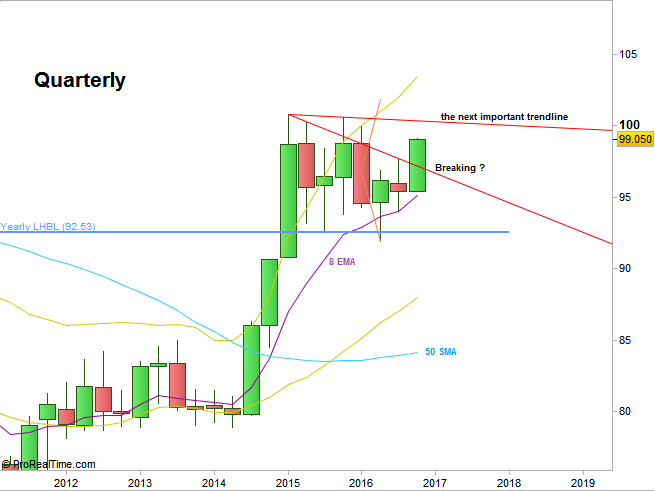
The current picture is very bullish, and in case the Weekly High is taken out, there are very good chances to see the Dollar Index reaching again the down trendline above, the 100 level area.
Taking out the Weekly High is a signal to reach the 102.2 level area, slightly above the 102 target of the 2016 2nd Quarter bullish pinbar setup.
I’ve mentioned before that as of the Yearly chart, most chances are that the current Yearly bar won’t make a new Yearly High (above 100.785), so for these targets that are mentioned above, it would be more likely to see them reached not earlier than the year 2017.

Dollar Index, Daily chart (at the courtesy of prorealtime.com)

Dollar Index, Quarterly chart (at the courtesy of proreltime.com)
Disclaimer: Anyone who takes action by this article does it at his own risk and understanding, and the writer won’t have any liability for any damages caused by this action.

