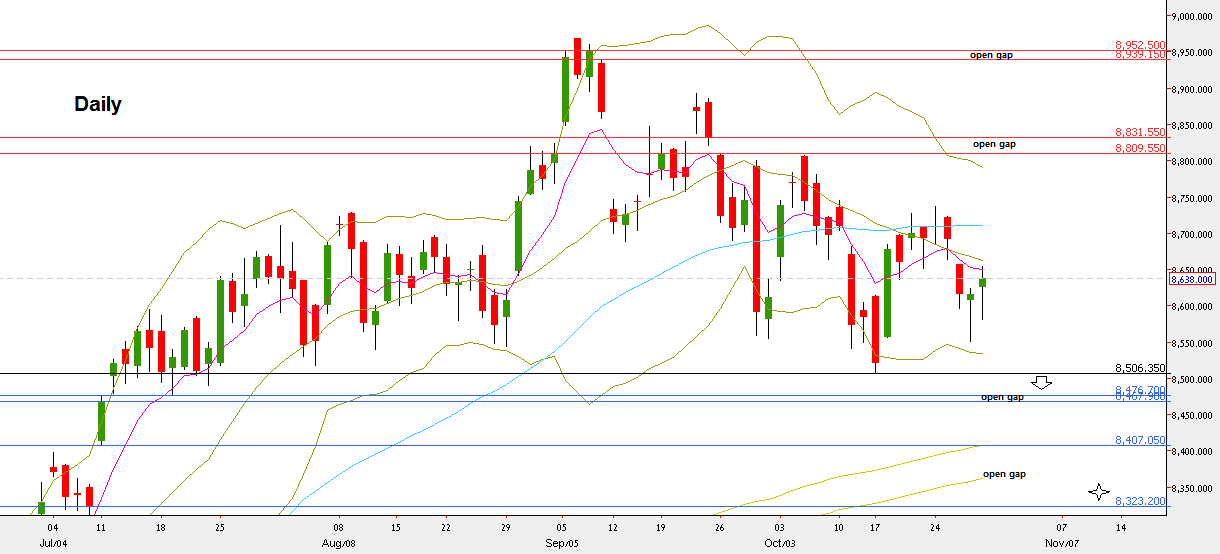
Like other stock markets the NIFTY50 has been trading in a relatively narrow range throughout the passing week. The market printed finally a Weekly pinbar on a sloping 20 SMA, but this time it closed below the Weekly 8 EMA, a sign of weakness.
Last review I mentioned that taking out the previous Weekly High at 8727 is a bullish signal of 1:1 with the amplitude of the pinbar, i.e. the 8940 area. The passing week has dampened this enthusiasm, and the Stop level which was below the previous Friday, finally got hit on Tuesday. Early Signs of weakness to come could be realized even before, as Tuesday immediately negated the weak breakup of the Weekly High and took out the Monday’s Low. When mentioning the cutting your losses short, they aim exactly to these situations where the actual behavior strictly negates the expected one at a certain spot.
Still it was a HH HL Weekly bar, and the more important thing is the structure of the Daily timeframe within. Pay attention how testing the Lows created a Daily bullish pinbar (last Thursday) that didn’t even touch the lower Bollinger band, followed by a HH HL bar on Friday, ended as bullish pinbar as well. This shows that there isn’t any thrust down at the moment, and we should see higher price values in the coming days.
The above mentioned contradicting signs (Weekly weak below the 8 EMA negating last bullish sign but the Daily strength towards the end of the week) mean that most likely we should expect another week of mostly sideways action, crawling upward. This is not a recommendation to go long currently, but another testing of the Lows that doesn’t take out the Low of October 17th, and that ends again with signs of strength is much more reliable entry, at least for 1:1 with the risk given.
Taking out the Low of October 17th at 8506.35 is a bearish trigger to challenge the open gap of 8323.2-8407.05, but this is a real change of behavior that is more typical to the volatile move that might happen in all stock markets after the US elections.

Nifty50, Daily chart (at the courtesy of netdania.com)
Disclaimer: Anyone who takes action by this article does it at his own risk, and the writer won’t have any liability for any damages caused by this action.

