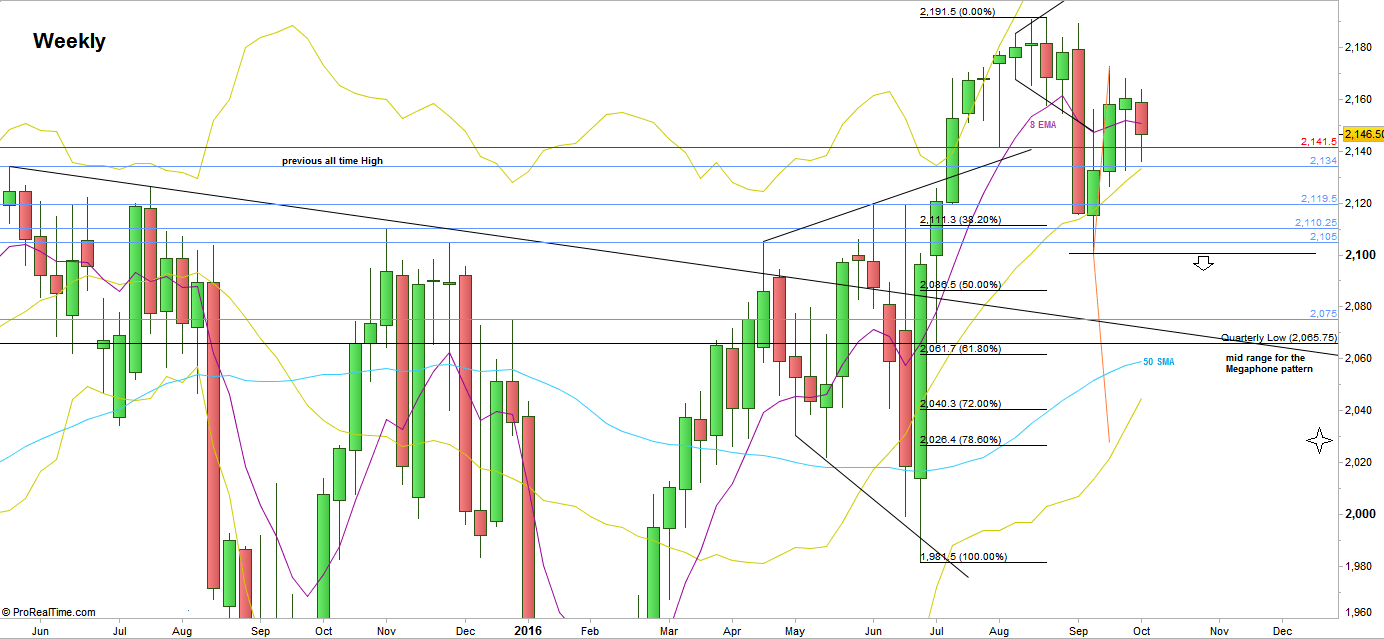
A quite, narrow range week has passed. Despite the NFP report, the whole Weekly price action was inner to the previous Friday’s Daily bar, September 30th.
The market continues to show signs of weakness. The Monthly bar is inner to a LH LL bar that was a second in a row that couldn’t reach the Monthly upper Bollinger band. The Weekly closed below the 8 EMA short term sentiment line (although is an inside bar), and the Daily closed as well below the Daily 8 EMA.
Daily swing bullish ideas should be considered only after taking out the Weekly High at 2172.75 (not the inner bar), closing the open gap above (2172.75 till 2177.5), retracing and continuing with a follow though up.
On the bottom of the range, the 2105-2113 area is a strong support. There is nothing to be surprised at if the market continues to be traded inside the current Weekly range throughout the week ahead.
Taking out the Monthly Low at 2100.25 is a bearish setup to reach the 2030 level, below the Weekly lower Bollinger band. Since the area below 2060 is a very strong support, don’t expect it to be an easy move down, and I expect some major fluctuations on the area of the down trendline taken from the previous all time High – currently at 2060 (see the chart). It is the mid range for the Megaphone pattern mentioned couple of times in the past reviews relating the Megaphone pattern typical behavior.
Pay attention that the Quarterly Low is at 2065.75, and if taken out, it most likely should be a false thrust down on the Weekly/Monthly timeframes. If this is going to be the case, there are many chances for it to be synchronized with the coming elections. Combine it with the fact that the market looks very bullish on the Semiannual timeframe, and there are chances for the Semiannual bar to close on the upper range of it.

S&P Futures, Weekly chart (at the courtesy of prorealtime.com)
Disclaimer: Anyone who takes action by this article does it at his own risk and understanding, and the writer won’t have any liability for any damages caused by this action.

