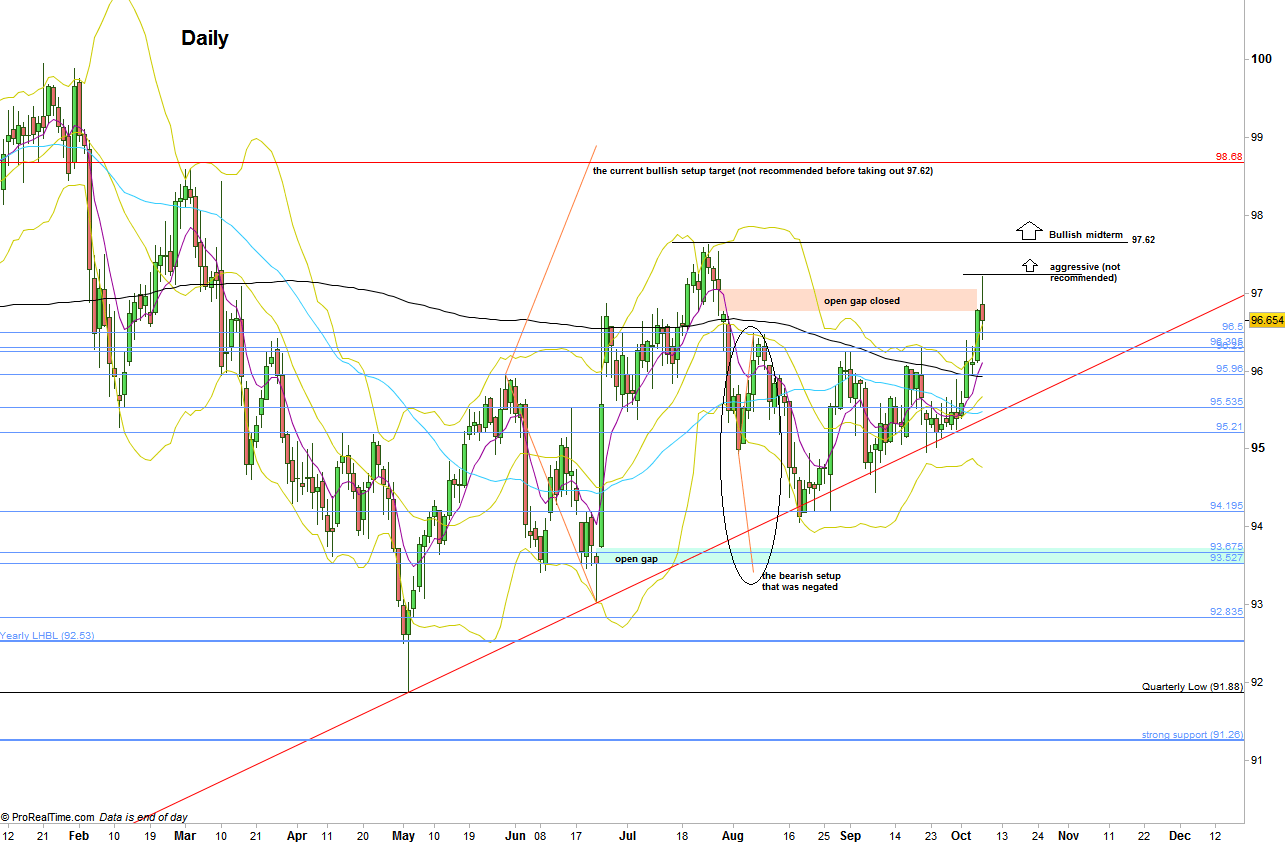
Finally the most important bearish signal was negated as the High of 96.5 has been taken out. Currently the most important level for the midterm is the High made on July 25th, at 97.62 which I suspected to be the start of a bearish wave 5 on the Weekly/Monthly charts to reach 87. The market has closed the important open gap at levels 96.76-97.042 and stalled on Friday, after reaching exactly the 88.6% retracement level of the bearish move since the end of July and touching the Weekly upper Bollinger band, finally withdrew. The Weekly bar closed finally above the Weekly 50 SMA, a sign of strength. The market did give a hint that the stop level (96.5) is most likely going to be taken out as last Tuesday closed above the Daily 200 SMA, not negated instantly on the Wednesday’s bar, which managed to hold above the 200 SMA, a clear sign of strength.
Taking out the High made on the passing week at 97.215 means most likely that the price action made throughout the last seven weeks was not a correction, and the High of 97.62 made at July 25th is probably going to be taken out, meaning that we are not in a Weekly/Monthly bearish wave 5 as I thought we were.
As long as the High 97.62 is respected, there is still a chance for a bearish wave to develop, meaning that the last week price action was nothing but a shakeout of the shorts before continuing down.
Currently there isn’t any reason to stay short, and we have to wait for the price action to confirm that it was a shakeout by a fresh swing bearish signal. Taking out the Low of last Friday at 96.405 is not a swing bearish signal.
From the bullish point of view, there is still a bullish signal to reach the 98.68 level – triggered on the Brexit spike (by taking out the High of 95.96), but I won’t recommend at the moment any bullish swing position before the 97.62 level is taken out. Taking out the High of 97.62 is a bullish signal by itself, to reach a new Yearly High, and if this is the case, then I’m very doubt that it happens before the end of 2016, meaning that most likely the 2016 Yearly bar remains as a inner consolidation bar before the market is going to continue the big bullish sentiment, not before next year.

Dollar Index, Daily chart (at the courtesy of prorealtime.com)
Disclaimer: Anyone who takes action by this article does it at his own risk and understanding, and the writer won’t have any liability for any damages caused by this action.

