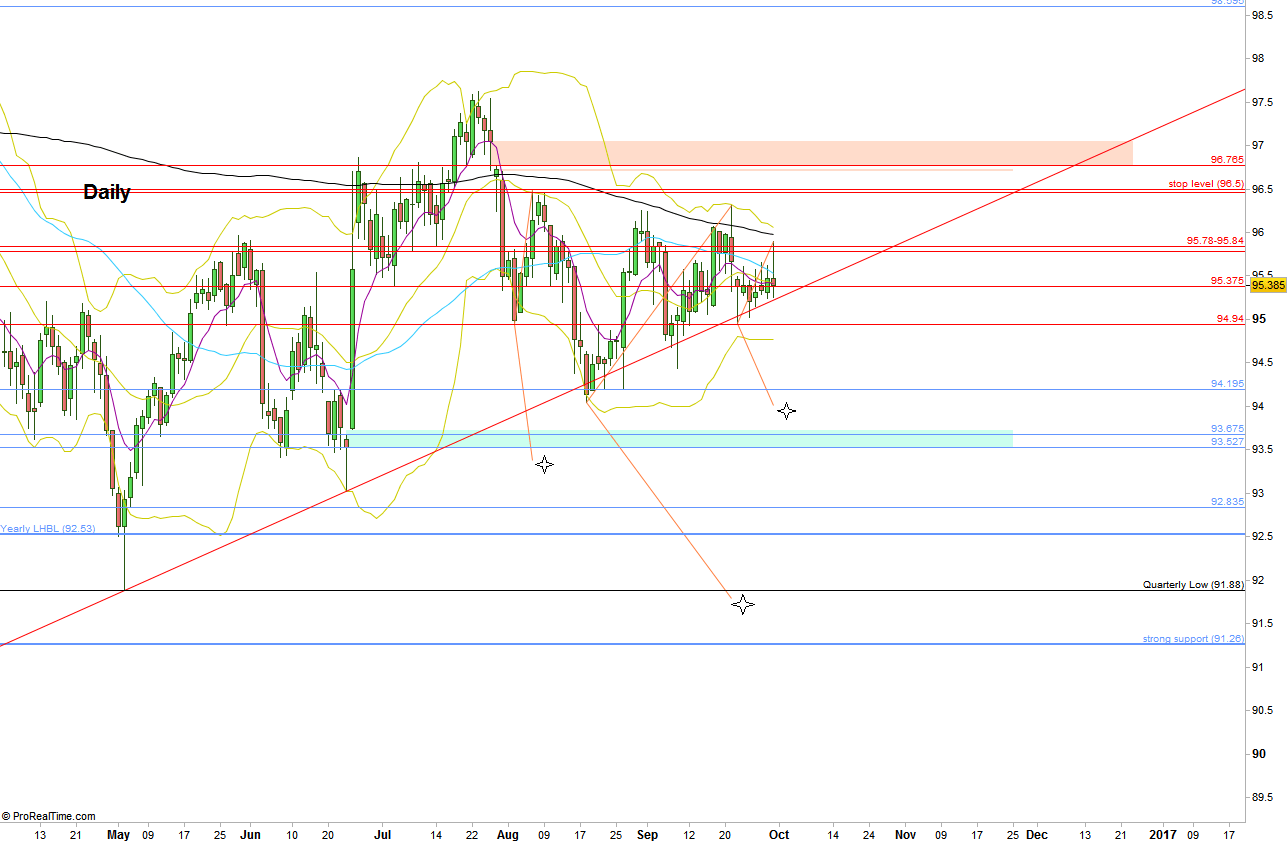
The Month and the Week ended very quietly as inside bars, closing in the middle. We are still in a big consolidation phase. A triangle can easily been spot on the Daily and Weekly timeframes, as well as the leaning on a major up trendline. The current sentiment is bearish. Pay attention that the Daily, Weekly and the Monthly bars – all closed below the 8 EMA short term sentiment line.
The midterm (months-quarters) wave 5 bearish idea down to 87 is still in play. No change in the stop level, above 96.5. Nothing changed much per the alarming boundaries, the Daily 200 SMA, the Weekly 50 SMA. The bearish signal to reach and close the open gap at 93.527 till 93.73 is still valid.
The current price action of the market is offering an interesting opportunity that can develop as a chain reaction finally into a major move down. Unless last Friday’s High is taken out first, then taking out the low of Friday, best if made by the first or second day of the coming week is a bearish setup to reach 94. Pay attention to the strong support at 94.19 that can bounce the prices before reaching this target. Reaching the target of 94 triggers another major bearish move (not necessarily without any major correction first) down below the Quarterly Low at 91.88. In this case, expect to have a major correction after closing the open gap currently at 93.527-93.73 (cyan), and/or after taking out the Low at 93.025. That (taking out the Quarterly Low) in turn, triggers another bearish setup to the 87 area mentioned in the previous reviews (but still a way to emerge).

Dollar Index, Daily chart, with the targets mentioned. (at the courtesy of prorealtime.com)
Disclaimer: Anyone who takes action by this article does it at his own risk and understanding, and the writer won’t have any liability for any damages caused by this action.

