As expected, the market has made a HH HL Weekly bar, closing rather weak. The target for the bullish setup given here last week has been achieved.
The signs of weakness are seen clearly on the Monthly timeframe where the last three Monthly bars couldn’t reach the upper Bollinger band, and the current Monthly bar which is about to close this coming week made a thrust down, and formed a LH LL bar. The signs of weakness are also In the Weekly timeframe where the Weekly bar closed below the Weekly 8 EMA short term sentiment line, as well as on the Daily timeframe where the thrust up last week couldn’t close above the Daily 50 SMA line, and a reversal down was made on last Friday.
All these signs of weakness do not mean a sharp decline in the coming week. There is even a very good chance to see the price makes a new Weekly High, but the real test as for the next midterm move is going to be by the end of the coming week, Thursday and/or Friday. Closing the week (and the month) above the Daily 50 SMA, the Weekly 8 EMA and the Monthly bar as a bullish pinbar should restrain the bearish sentiment, and probably the market is going to start October going sideways in the current range. I would give less chances for that scenario. Currently, by looking at the higher timeframes there are more chances to see the bearish sentiment (bearish only for a Monthly correction) continues in October.
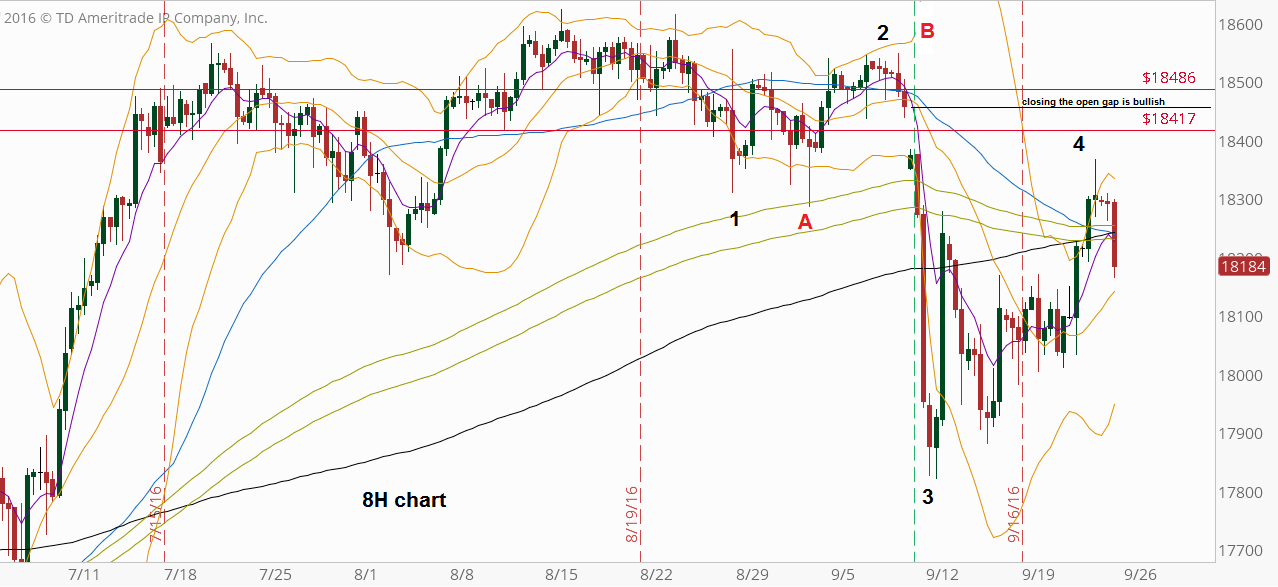
As for the chart, lets drill down to the 8H chart. Closing entirely the open gap from above is bullish and most likely means that we we’ve already seen the Low of this correction. Making a new Weekly High, reaching the 18417 resistance area as a top (reversing down) means that we are in an A-B-C correction and most likely we haven’t seen yet the Low of C. Otherwise, a thrust up that doesn’t take out the High of 4, reverses down and takes out the 18011 level means by most chances that we are in wave 5 of the correction (i.e. wave 4 didn’t penetrate wave 2, except for spikes)

Dow Futures. 8H chart (at the courtesy of thinkorswim.com)
Disclaimer: Anyone who takes action by this article does it at his own risk and understanding, and the writer won’t have any liability for any damages caused by this action.

