This Beaten-Down Stock Could Pay Off Big by Summer

With the gaming industry so dependent on China for a chunk of its fortunes, it seems odd that Las Vegas Sands (NYSE: LVS) is poised to rally over the next few months.
The Chinese stock market fell to a 13-month low this week, reflecting weakness in the country’s economy. But positive traffic data in Macau gave casino stocks a boost, and it seems some analysts are starting to see improvements stateside as well.
But as a chartist, I’m more excited about the improved technical conditions and still excessively bearish sentiment, which could make for the beginnings of a bullish case for LVS.
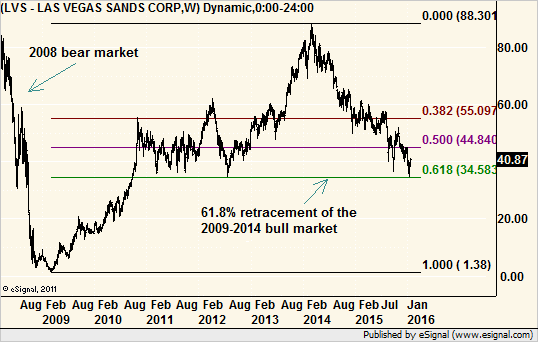
We’ll start with the bigger picture. The weekly chart shows a steep drop during the 2008 financial crisis, followed by a steady recovery through early 2014.

A set of Fibonacci retracement lines applied to the bull run helped define support for the 2014-2015 pullback. And now the stock has once again dropped to the key 61.8% retracement level of the rally.
On their own, Fibonacci support and resistance levels are often questionable. However, the current retracement coincides with traditional chart support at a series of lows in 2010 through 2012. That makes the $ 34.50 level a key one to watch and a very good place to look for a bottom.
Of course, we need more than just a bottom from the past to give us a reason to buy. And for that we’ll zoom in on the daily time frame.

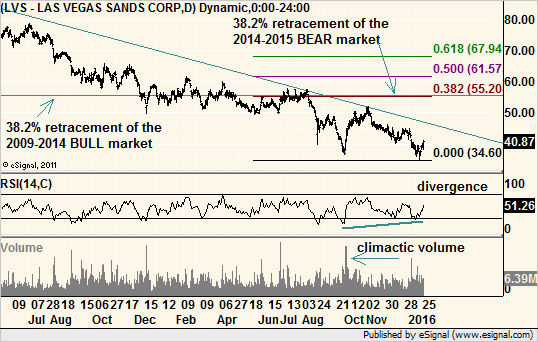
The first thing to notice is the trend, which is straight down since March 2014. This means we will need real evidence that the bears are tiring, as fighting this inertia could be difficult.
Next, we see long-term support near $ 34.50 coming into play. The stock fell sharply to that level in September, and then quickly bounced on very heavy volume. Given the long decline and its acceleration in mid-2015, this had the look of a selling climax, or final washout, as the last hopeful bulls finally gave up.
The ensuing gains did not last, though, and LVS settled back down for another test of support. But this time, technical indicators such as the Relative Strength Index (RSI) and on-balance volume (OBV) did not fall as far. By setting higher lows, both indicators set up bullish divergences with price action. Price usually follows these indicators, which is up in this case.
On Jan. 20, the broader market fell sharply intraday before recovering. Most major indices formed bullish hammer candle patterns by opening lower and closing near their highs with a sharp intraday dip in between. So, too, did Las Vegas Sands.
However, unlike the market, LVS immediately confirmed its reversal with gains over the next few days. In fact, it is already up more than 17% from its Jan. 20 low compared to a mere 5% for the S&P 500. It may seem like the easy money has already been made, but when put in the context of a stock that fell 60% in two years, this advance pales in comparison.
I could see LVS rallying back to the $ 55 level over the next few months, where more Fibonacci levels meet. But first it has to get through the declining trendline drawn from 2014, currently in the $ 46 area. So even if you are a trend follower and not a bottom picker, there is room for a countertrend rally to test the trendline.
The kicker here is that the stock throws off a generous 6.4% dividend yield. We’ll have to wait until March to lay claim to the first payment, so the initial strategy of buying for a return to the trendline will not benefit. But if LVS can break through that trendline, we will be able to capture that payout on the way to the second target.
Recommended Trade Setup:
— Buy LVS at the market price
— Set stop-loss at $ 16.80
— Set initial price target at $ 46 for a potential 13% gain in four weeks
— Set second target at $ 55 for a potential 35% gain in five months
Note: For traders looking for even bigger gains, there is a simple strategy that could allow you to make a 189% profit on that 35% move by risking just $ 700. To find out how, follow this link.

