Why I Remain Skeptical Heading Into the New Year

Directionless volatility in the U.S. stock market continued during the holiday-shortened trading week, as all major indices closed sharply higher on the heels of two straight weeks of losses.
Last week ‘s surge higher was led by the downtrodden energy and materials sectors — the two worst performers of 2015. A rebound in oil prices and industrial and precious metals apparently provided hope that some economically influential commodities may have at least temporarily found a bottom.
Bigger picture, however, 2015 has been a lackluster to disappointing year for most individual sectors of the S&P 500. And when all was said and done, the broader market index ended last week right where it began its most recent bout of sideways, choppy behavior in late October. This indicates temporary investor indecision, which typically becomes the springboard for the next directional move.
In this week’s report, I will cover three charts that should help us determine whether that move will be up or down.
Investor Fear Remains Key
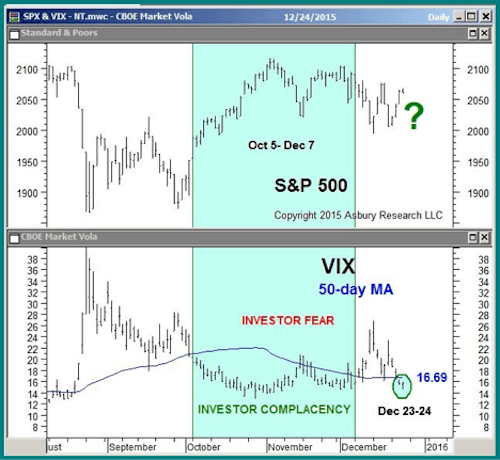
In last week’s Market Outlook, I pointed out that the Volatility S&P 500 index — better known as the VIX or fear gauge — had been above its 50-day moving average since Dec 10. I advised readers to implement defensive strategies to protect their assets against a deeper market decline as long as this was the case.
The bellwether S&P 500 sharply declined to hit a low of 1,993 on Dec. 14 before recovering late last week. The recovery pushed the VIX back below its 50-day moving average, indicating a state of investor complacency like the one that triggered and fueled the early October to early December rise in the S&P 500.

If the VIX can stay below its 50-day this week, currently situated at 16.69, it will suggest that enough investor fear has abated to support a potential rise back to the S&P 500’s all-time high at 2,135, made in May.
Price Action Must Confirm
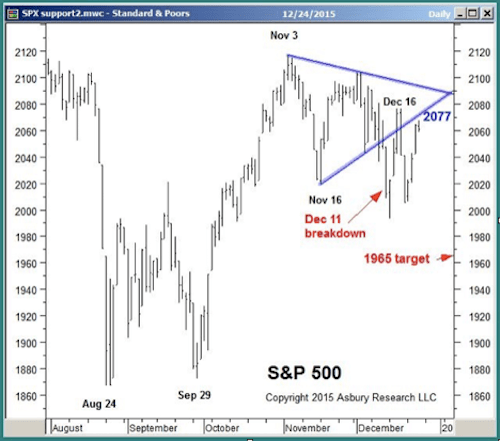
The next chart addresses just how far the S&P 500 has to rise to turn the chart bullish. In the Dec. 14 Market Outlook, I pointed out a breakdown in the S&P 500 following a month of sideways action. This targeted a decline to 1,965, which remained valid below the lower boundary of the pattern at 2,057.
The index traded as high as 2,077 on Dec. 16, briefly moving back inside the indecision area. It then fell back out, finishing last week just below the lower boundary.

As long as the index remains below 2,077, my 1,965 downside target remains intact. However, if the index can make a sustained move above 2,077, especially on a sub-16.69 reading in the VIX, that would indicate investors are now betting on a potential retest of the 2,135 high.
Keep a Close Eye on Exxon
Part of the reason the U.S. stock market has been so choppy this year is that many influential market indices and individual stocks have been negotiating major inflection points from which their next sustainable price trend is likely to begin.
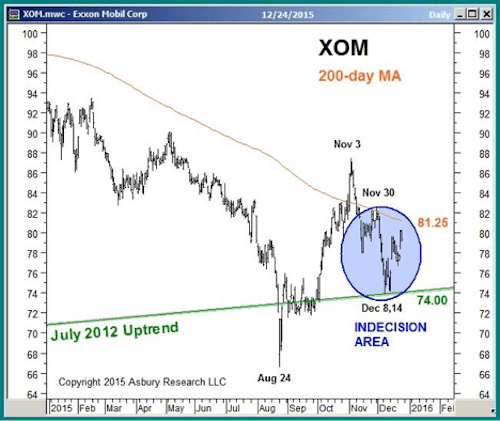
Exxon Mobil (NYSE: XOM) is one such stock. It is one of the largest U.S. stocks by market cap and has been positively correlated to both crude oil prices and the S&P 500 over the past few years.

The chart shows XOM sandwiched between long-term support from its July 2012 uptrend line and intermediate resistance from its 200-day moving average. This has largely been the case since August, with prices getting squeezed as the two major trend proxies moved closer together.
A sustained move either above $ 81.25 or below $ 74 is necessary before we can conclude investors have made up their minds on this energy bellwether’s — and, per the aforementioned correlation, the broader market’s — intermediate trend. Until then, expect more directionless volatility as the bulls and bears continue to duke it out.
Time to Pay Attention to Gold
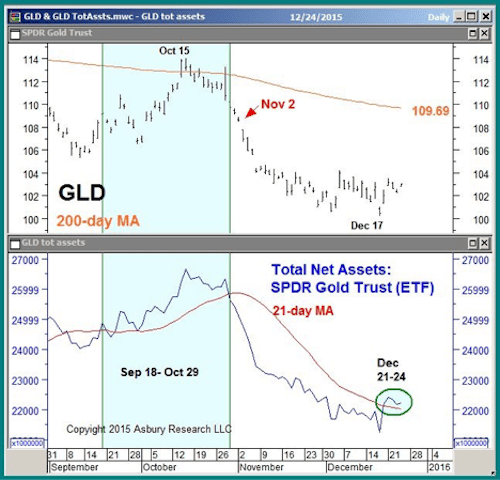
Finally, I’d like to give you a quick update on gold. In the Nov. 2 Market Outlook, I pointed out the emerging trend of monthly contraction in total net assets invested in the SPDR Gold Shares (NYSE: GLD), adding that gold bulls may want to take a defensive stance since declining investor assets typically drive prices lower.
Following that report, GLD collapsed an additional 8% to a Dec. 17 low of $ 100.23. It then rebounded a bit to close last week at $ 103.05.

The good news (potentially) is that the chart also shows total net assets invested edged back above their 50-day moving average last week. A similar monthly expansion fueled the ETF’s advance from mid-September to late October.
Although it is too early for all but the most aggressive gold bulls to get back into the market, I view the recent expansion in assets as the first sign in some time that a bullish opportunity could be emerging.
Putting It All Together
The decline in market volatility at the end of last week suggested the U.S. stock market could be gearing up for a Santa Claus rally. Plus, almost 60 years of seasonality data show the first week of January is the seasonally strongest of the entire first quarter. But we need to see a sustained rise above 2,077 in the S&P 500, preferably with a VIX reading below 16.69, to indicate the market could make a run for its all-time high.
Given this year’s choppy, directionless trading, I’m also looking for strength in market bellwethers like Exxon Mobil to confirm that any rally that emerges between now and year end is sustainable. In short, I remain skeptical heading into the new year.
Editor’s note: We just started showing folks this Wall Street “insider” secret, and already the gains have been amazing. Traders in on it could have turned $ 10,000 into more than $ 24,000 in just a few weeks. There are still a few days left to get on board. To get all the details on this “insider” secret and the latest trades, click here.

