Warning: Market Fell 57% After it Flashed This Same Signal
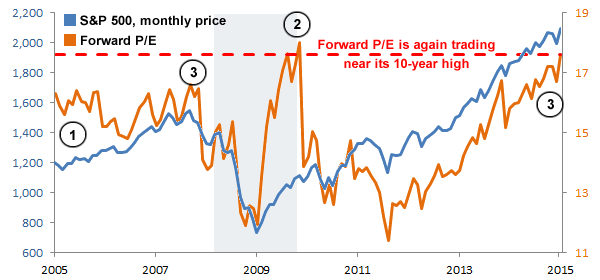
The anomaly I see today has only occurred twice before in the past decade.
The last time this indicator flashed its current reading was at the end of 2009, and within six months, the market had undergone a correction.
The previous time it was even close to this high was in October 2007, when stocks began a 17-month, 57% decline. Needless to say, I’m concerned.
Under-promise and over-deliver has been the mantra on Wall Street for the past few years. Companies have done an excellent job setting the earnings bar low so they can leap over it and please investors.
But what happens when the bar can’t go any lower? What if valuations are richer than they were in 2007 when the bubble was about to burst? And what if estimates for earnings growth turn negative?
Pepper in an increasing interest rate environment and some global economic stress and you have a recipe for a correction.
Now, I’m not forecasting the next recession, but there is cause for concern. Based on my research, I anticipate an 8% pullback in the S&P 500 over the next few months. In addition to using this knowledge to do some proactive portfolio protection, there’s a way to amplify that pullback into 97% gains.
Valuations Getting Stretched
I look for patterns in the markets to lead me to profitable opportunities. Patterns go beyond the prices of stocks, indices and commodities. They can be found in everything from seasons to volume and even in valuations such as the widely used price-to-earnings (P/E) ratio and forward P/E.
The P/E multiple is one of the most common and effective means of quickly determining the relative value of an asset. Finding a P/E is simple: Take the current price of a stock and divide by annual earnings per share (EPS). So a $ 10 stock with $ 1 in annual earnings would have a P/E of 10 ($ 10/$ 1). If that same stock was expected to earn $ 2 in the upcoming year, it would have a forward P/E of 5 ($ 10/$ 2).
You can do the same with an index like the S&P 500, which gives you an idea of the market’s valuation.
P/E ratios drop when profits grow faster than stock prices, which is good for the bulls. When profits drop, P/E multiples rise assuming the price of the stock or index is stable. P/E ratios also go up when profits stagnate and asset prices continue to rise. Neither of the latter scenarios is desirable if you’re bullish.
The chart below shows the price of the S&P 500 index (blue line) and its forward P/E ratio (orange line).

At 17.62 based on 2015 estimated earnings, the P/E multiple for the S&P 500 is at its highest level in almost 10 years. It’s not only near the abnormally high 2009 levels, but it’s a full point higher than the peak of 2007 and well above the 10-year average of 14.88.
On the chart, I have circled three scenarios that lead to a high forward P/E ratio in the S&P 500. The first two are generally acceptable and have allowed stocks to rally further, while the third is problematic. Unfortunately, that is the situation I believe we are currently in.
Scenario 1: Future earnings estimates are increasing while investors are buying in anticipation of continued growth. This usually occurs in the early to middle stages of a recovery. There is often a catalyst for growth like we saw during the commodity and housing boom in the early to mid-2000s.
Scenario 2: As we depart a recession/bear market, stock prices rally ahead of an anticipated recovery, but P/Es get too high and stocks correct. However, if there is real, positive economic and earnings growth to support stock prices, they should resume their uptrend like they did in mid-2010.
Scenario 3: Stocks are pricey and we are seeing slowing earnings growth with no major positive catalysts on the horizon. This is the situation we’re in, and it warrants extreme caution.
The current record forward P/E multiple might be more acceptable if we weren’t nearly 70 months into a recovery, well beyond the average economic expansion time of 58.4 months.
Making matters worse, most of the near-term catalysts seem bearish. The market is bracing for an interest rate hike and the effects of a stronger U.S. dollar, both of which will hurt S&P 500 earnings. And other major economies around the world are slowing or entering into recession.
Earnings Estimates Lowered
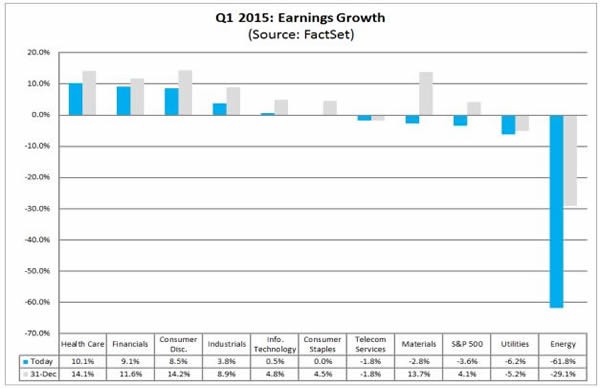
Perhaps the elephant in the room is the dramatic downward revisions to Q1 earnings growth over the past couple of months. According to FactSet, 10 of 11 sectors have seen negative growth revisions since the end of 2014, with energy-related earnings now expected to contract by more than double previous estimates.
Zacks, an authority on earnings trends, now estimates negative growth for S&P 500 earnings in Q1 and Q2.
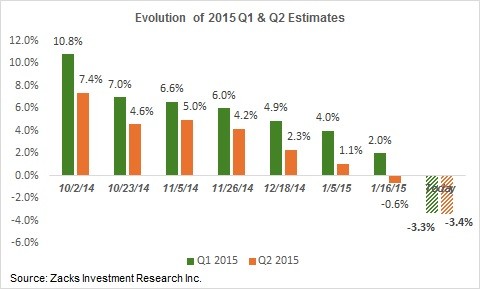
Yet, despite this trend, the S&P 500 has added 2% year to date.
This uptrend is not likely to continue. The realization of deteriorating earnings growth will cause the market to “reset,” or correct to more normal valuations, over the next few months, especially as we begin seeing Q1 earnings results.
According to Bloomberg, analysts expect the S&P 500 as whole to earn about $ 119 per share in 2015. While I believe that’s ambitious, we’ll go with that estimate.
I expect the forward P/E to head closer to the 10-year average of 14.88, but to be conservative, let’s assume it falls to 16.25, which is the halfway point between the current value and the historical average.
Assuming a forward P/E of 16.25 and $ 119 in earnings, that puts the S&P 500 at a value of 1,934. With the index currently trading around 2,100, we would be looking at an 8% decline.
The SPDR S&P 500 ETF (NYSE: SPY), which tracks the S&P 500, costs roughly one-tenth the price of the S&P 500. So if the index hits my target of 1,934, SPY will trade around $ 193.40. I am rounding my target to $ 194. Using a put option strategy, we can turn that 8% drop into nearly 100% profits.
SPY Put Option Trade
Today, I am interested in buying SPY Jun 217 Puts for a limit price of $ 11.70.
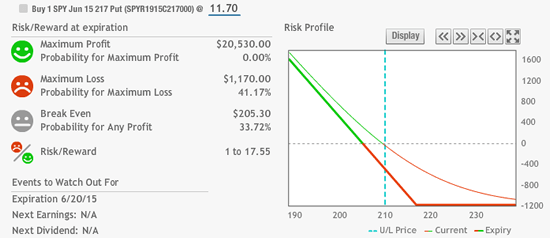
Risk graph courtesy of OptionsHouse.
This put option has a delta of 68, which means it will move roughly $ 0.68 for every dollar that SPY moves, but it costs a fraction of the price of the stock.
The trade breaks even at $ 205.30 ($ 217 strike price minus $ 11.70 options premium), which is 2% below current prices.
If SPY hits our downside target of $ 194, the put options will be worth at least $ 23. Once you enter the trade, place a good ’til cancelled (GTC) order to sell your puts at that price.
Recommended Trade Setup:
— Buy SPY Jun 217 Puts at $ 11.70 or less
— Set stop-loss at $ 4
— Set price target at $ 23 for a potential 97% gain in four months
Note: If you’re looking for additional ways to protect your portfolio, there is a little-known shareholder right that lets you rent out the stocks in your portfolio for additional monthly income. This cash can help offset losses in a market decline, and in some cases, traders are collecting $ 1,200 or more each month. To learn how you can do the same, check out the presentation.

