
The Dollar index made a quite impressive move down towards the target mentioned many times before, at the 96.2 area (to be more precise, 96.12). The price action of the past 2 weeks would have suggested that we see a more of a crippled move down (with deep corrections up) as I’ve mentioned on the last review, but the passing week was quite decisive as for the direction down, where all the days except for the last Thursday had a significant thrust down.
The levels around 96 are clear support level, and approximately a 61.8% retracement level of the last bullish wave started a year ago. The level of 96.12 as a target is being stated since two models point at that level: The first is the Follow-through bearish model mentioned on these reviews throughout the last 3 months, and the second model is a potential AB=CD wave pattern(see chart).
In addition, is it slightly above an important Low, the Low of November 2016, and an important demand zone, from which the last time the price has been there (the US elections), it broke up sharply, an event that usually leaves many unfilled orders keep on waiting.
For the coming week, pay attention for a LL right at the beginning of the week which can indicate that the thrust down is more likely to continue (though expect some correction back, even a deep correction into the last week’s range before the thrust down continues). Otherwise, if the coming Monday’s bar is going to be completely inside the last week’s range, -a thrust up on the next day indicates that the whole coming week is most likely going to print an inside weekly bar.
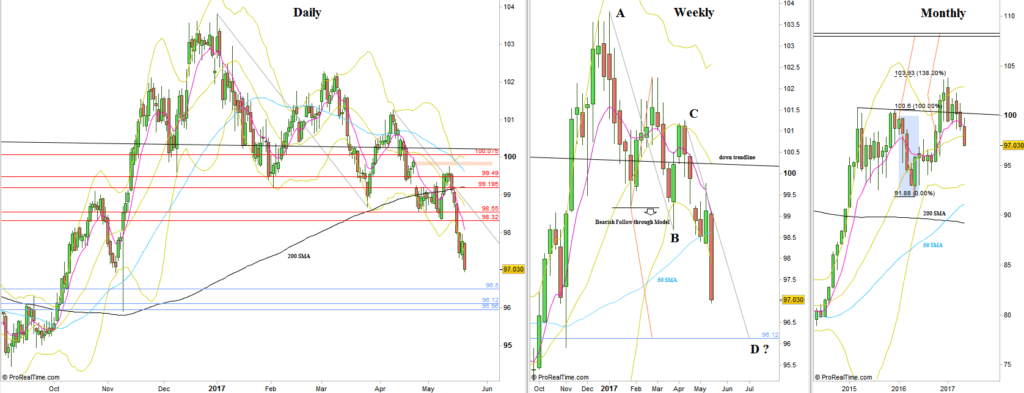
Dollar Index: Daily, Weekly and Monthly charts (at the courtesy of prorealtime.com)
Disclaimer: Anyone who takes action by this article does it at his own risk and understanding, and the writer won’t have any liability for any damages caused by this action.