
After the slow and creeping decline of the last 7 weeks, there came the passing week with a strong bullish week, gap up, managed to test the all time High levels and negating all the bearish setups that had been made on the Daily and Weekly timeframes lately.
The Monthly bar of April closed bullishly, but as an inside bar. There is a room for manipulation on the coming week if the Monthly inside bar’s High at 2394.75 is taken out, but not the all time High.
Otherwise, if the coming week is going to make consolidation on the current Weekly range without taking out the High at 2394.75, keeping the gap below still open, then taking out the Monthly inside bar’s High on the next week is going to be a good bullish signal to make a new all time High, continuing higher. In this case the amplitude created within this consolidation can point to the next major target level, the target of the year 2016 first half Semiannual bullish Pinbar, at the 2430-2440 levels.
As for the Daily timeframe, if the market is going to consolidate this coming week, then testing the Weekly High again without touching the upper Bollinger band, reversing back down – can develop a Short opportunity, back to the middle of the current big range (Daily 50 SMA and 20 SMA, Weekly 8 EMA).
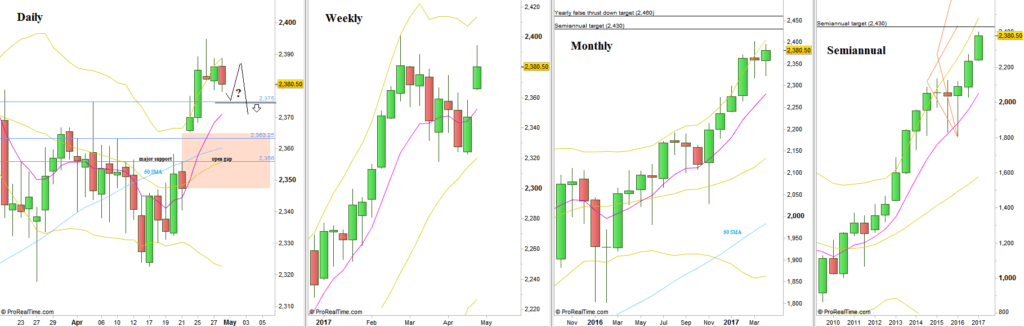
S&P Futures, various timeframes (at the courtesy of prorealtime.com)
