
The passing week with its news turned out to be a big shakeout against weak Longs in the FTSE. The abbreviated trading week has begun with a gap down and weakness that pushed the market down considerably, with a volatility that has been seen since the US elections, back to the root level of the last February Monthly Spring, at the 7095 levels. Throughout the rest of the trading week there was a clear shortening of the thrust down. The short term bullish setups to the level of 7510 have been rejected.
The important thing to notice as of price action, is that still after such a bearish momentum, the price got very closed to the Monthly Swing Low at 7093.5 but couldn’t take out that Low, a clear sign of strength.
The coming Week with its own news from France can bring further volatility.
Taking out the Daily High at 7134.5 can easily push the market up to the most important resistance level around, at 7192.
On the other hand, taking out the Monthly Swing Low is bearish for the midterm, and without further bullish development (e.g. a Spring), most likely we see in the midterm the price returning back into the famous 15 year range.
In this case expect the price to reach the level of 7020 closed to the Daily 200 SMA before a major correction up is most likely to start.
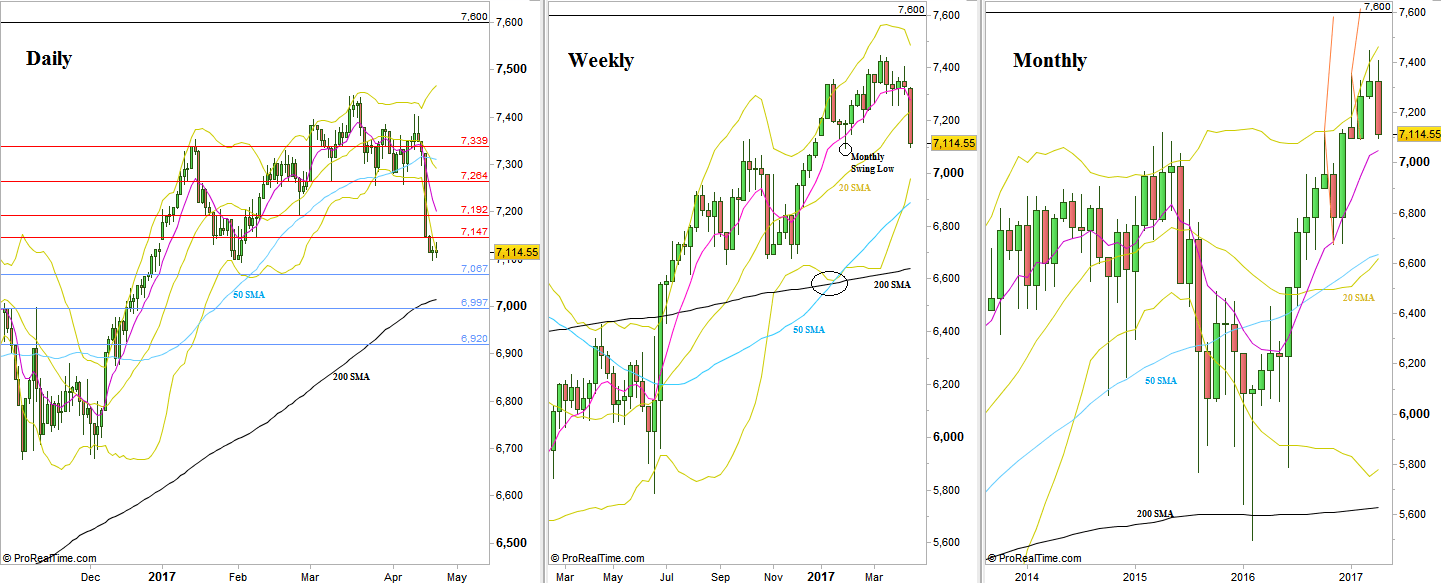
FTSE100: Daily, Weekly and Monthly charts (at the courtesy of prorealtime.com)
Disclaimer: Anyone who takes action by this article does it at his own risk and understanding, and the writer won’t have any liability for any damages caused by this action.