
On the lower timeframes, The Dow looks weaker than the S&P and the Nasdaq. As mentioned in past reviews, the reason may be that the most of the major targets have already been achieved. Currently there are two major targets remaining for a bullish setup, both currently are quite far: The target of the year 2016 last Quarter’s Spring bar (caused by the US elections) that points at 22500 and the Yearly bullish Pinbar on sloping 8 EMA, pointing at 24500. So, if we are in a major correction phase in the stock markets, the Dow may present worse performance than the S&P and the Nasdaq.
The passing week closed below the Weekly 8 EMA short term sentiment line for the first time since the US elections on November. But the main signs of weakness are reflecting from the Daily timeframe price action, as two Upthrusts (false thrust up turning into considerable decline) took place last Monday and Wednesday.
There are two bearish signals (already triggered) on the Daily timeframe that might concern:
The first is the most important Daily bar lately, the Wednesday April 5th bar, a bearish Pinbar on sloping 20 SMA with the target at 20288. This, itself, would not be a good bearish signal, and you can see the manipulation carried out the following days – despite being triggered right on the next day (taking out its Low). The Continuing signs of weakness on the following days were those to make it much more meaningful.
The second is the Follow Through model on the Daily, triggered by taking out the Low of last Tuesday at 20448, pointing slightly lower than the former setup, at 20255.
Both setups have targets below the Monthly Low, while taking out the Monthly Low is a bearish setup to reach 19900. As mentioned in the previous review it is not a qualitative bearish signal for a bearish Swing, as this would be the first Weekly countertrend Swing, prone to trouble.
On the other hand, if the market takes out the Monthly Low but eventually develops a bullish Weekly bar on the current sloping Weekly 20 SMA (converging with the upper mentioned targets for the coming week), then a thrust up above its High on the following week would be a good bullish opportunity to reach the upper range once again.
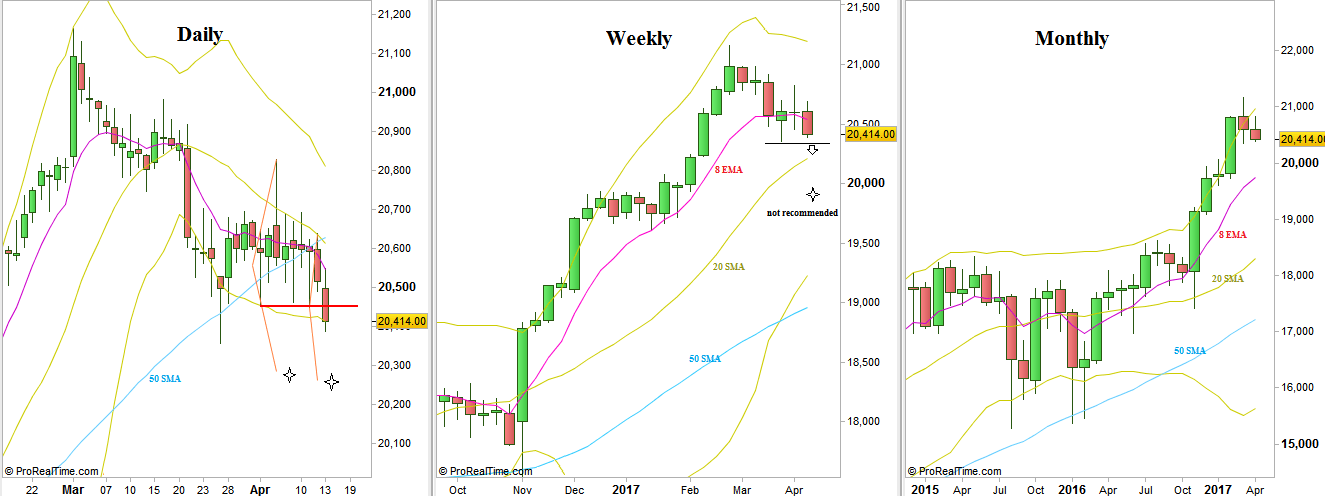
Dow Futures: Daily, Weekly and Monthly timeframes (at the courtesy of prorealtime.com)
Disclaimer: Anyone who takes action by this article does it at his own risk and understanding, and the writer won’t have any liability for any damages caused by this action.
