
FTSE was one of the stronger stock markets over the passing week. The week has started with a tiny Daily Doji while the rest of the week continued revolving around the middle, closing at Thursday a bit weaker, below the Daily 8 EMA. Eventually, the Weekly bar closed above the 8 EMA short term sentiment line, a sign of strength.
Last Tuesday, the market took out the Daily Swing High at 7384.8. By taking out this High, a Follow through bullish signal has been triggered towards 7510, which is the same target as the target of the year 2016 first half Semiannual bullish Pinbar on sloping 8 EMA (and on sloping 20 SMA as well).
For the coming week, taking out the Weekly High at 7406.35 is another bullish Follow through signal to reach the same level, 7510. Now we have three different bullish signals pointing at the same level of target. If you like, there are actually four, since the Weekly bullish Pinbar on sloping 8 EMA three weeks ago points at that level as well.
For new Daily Swings, I recommend to wait for the last signal to appear, i.e. taking out the current Weekly High.
Above that, the next target area is at 7560-7600. This is the target area for the Monthly Follow-through model mentioned in the past which is also the target of the Quarterly bullish Pinbar on sloping 8 EMA of the last Quarter of 2016. The level area is also the target of the false thrust down of last February that eventually turned out to be a Spring.
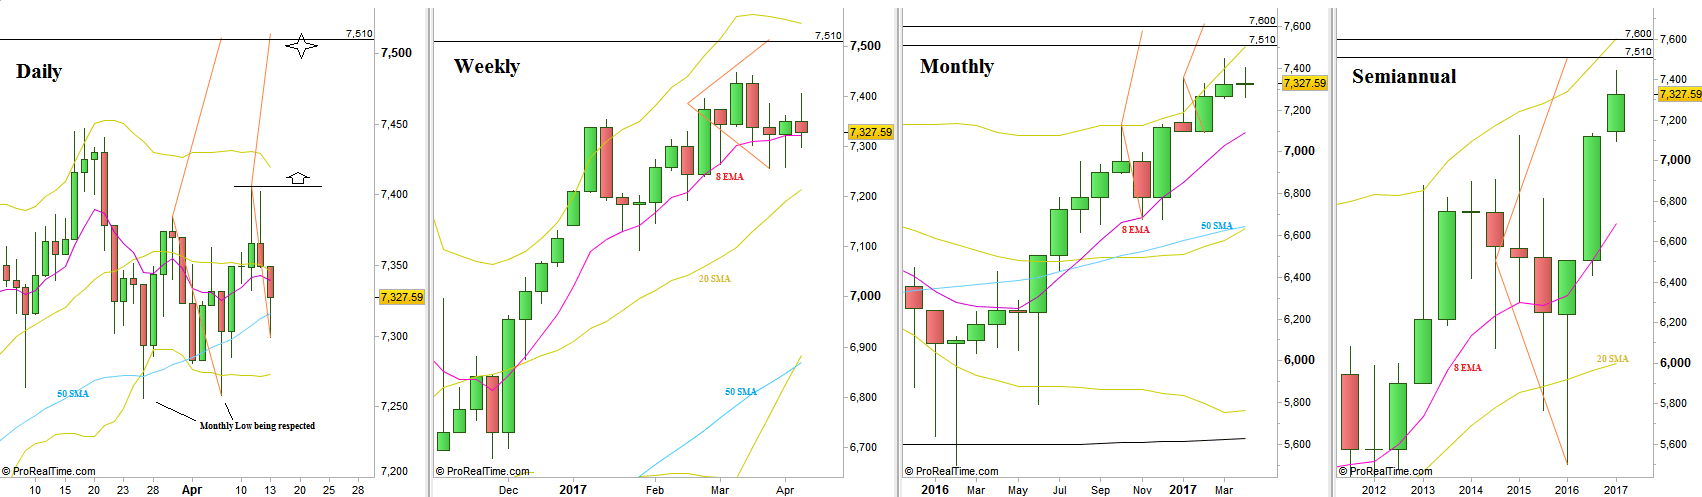
FTSE100, Various timeframes (at the courtesy of prorealtime.com)
Disclaimer: Anyone who takes action by this article does it at his own risk and understanding, and the writer won’t have any liability for any damages caused by this action.