Most of the passing week revolved around the runaway gap the market left lately (9173.75-9188) that eventually turned into an exhaustion gap. At the start of the week a reversal attempt above the gap that left it open was completed, but strong bearish sentiment around the stock markets on last Wednesday led to a capitulation of the bulls, closing the week finally on the Lows, a clear sign of weakness.
The market is most likely on its way to test another open gap, 9101-9109, where the price is going to meet the Weekly 8 EMA short term sentiment line.
Below it, there is a more important open gap created by a kicker pattern. The kicker pattern appears when the market changes its sentiment by 180 degrees immediately from a bar to the next bar. This is a clear support area where many unfilled orders are waiting to be filled as the last time the market had been there, the price left rapidly.
Any sign of strength followed by a reversal up without closing one of these gaps completely is a good bullish signal. The strongest support in that area is at 9073.
We are still in a bullish setup of the Weekly bullish Pinbar 3 weeks ago to reach the level of 9365, and the Stop for that signal is below the Weekly Pinbar’s Low, at 9024.65.
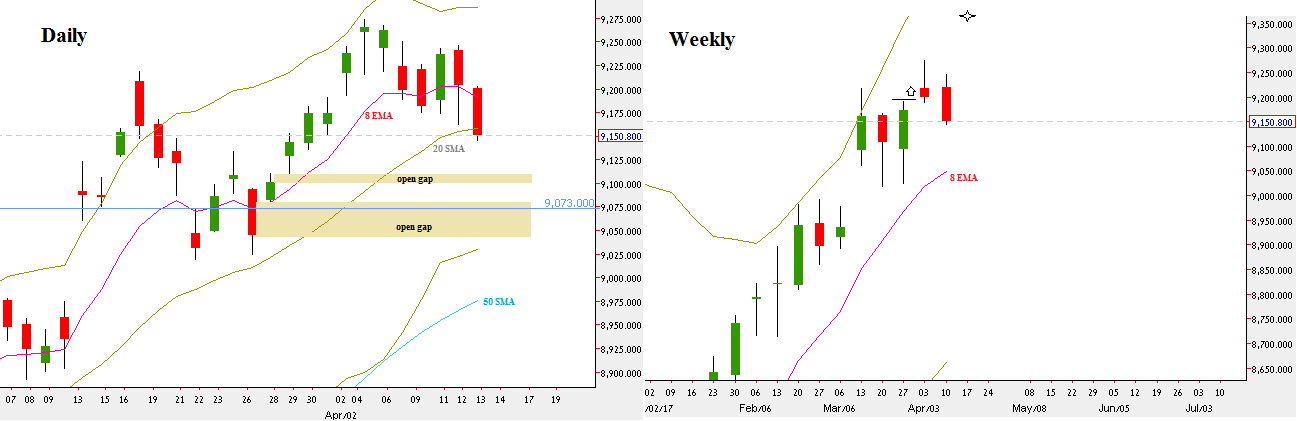
NIFTY50, Daily and Weekly charts (at the courtesy of netdania.com)