
A very bullish week has passed over the Dollar Index, started with a new Weekly High on last Monday, setting as well the Weekly Low for the rest of the week, finally setting the High of the week on the Weekly 20 SMA, right after the NFP report.
As pointed out on the last review, a thrust up above the Weekly High meant by most chances a rejection of the bearish setup that had been developed for the last 4 months. So, the market has signaled that it was short term bullish by making the thrust up even on the very first trading day of the week.
The target of the current rally is a new Monthly High, at 102.32.
The big question for the longer term is whether that target is going to be reached fully, i.e. taking out the Monthly High. Reaching 102.32, which means taking out the Monthly High is a bullish trigger of the Monthly bullish Pinbar on sloping 8 EMA. That will most likely eliminate any other midterm bearish attempt on the current range.
Back to the smaller timeframes, if on Monday (only Monday) the market takes out the last Friday’s High (the Weekly High), it is a bullish signal to reach and close the tiny open gap left between March 9th and 10th (101.845-101.853). Stop level is below last Friday’s Low.
Another scenario that may develop if the price doesn’t take out the Weekly High on the coming Monday, is to see a withdrawal back to the support level at 99.815, which is approximately the current Monthly 8 EMA level. From that point new signs of strength can give a bullish signal to reach the target mentioned above, at 102.32 (or closed to it – as was distinguished above).
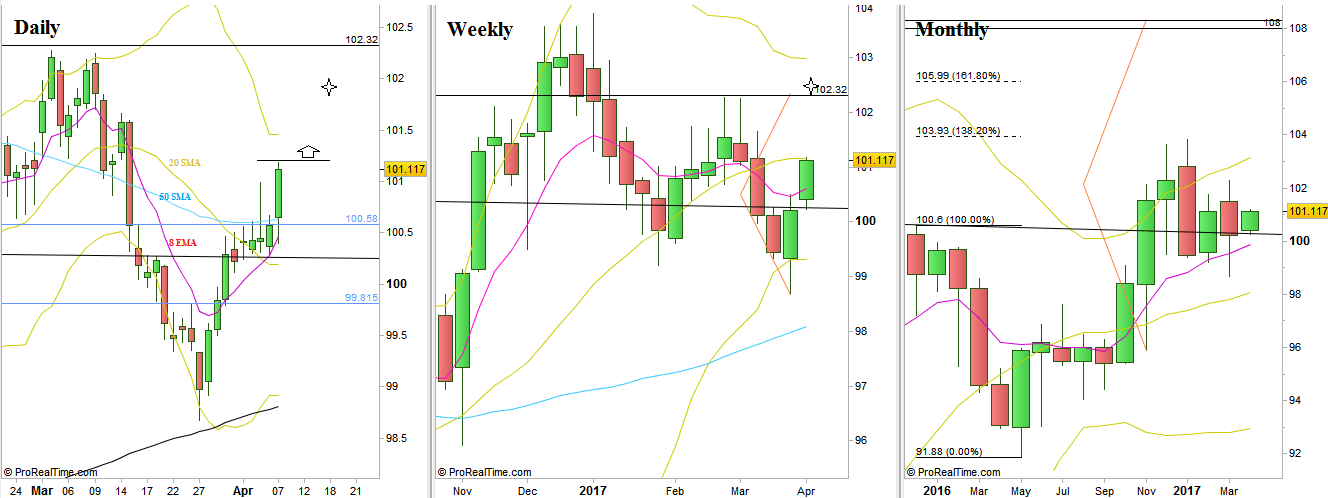
Dollar Index: Daily, Weekly and Monthly timeframes (at the courtesy of prorealtime.com)
Disclaimer: Anyone who takes action by this article does it at his own risk and understanding, and the writer won’t have any liability for any damages caused by this action.
