As expected, by the end of the Quarter, the Dollar index has returned back to the famous down trend line (mentioned lots of times on past reviews).
The Weekly bar inner price action was pretty impressive. It started with a gap down, but still has given the opportunity to short the Daily bearish Pinbar of the previous Friday, for a 1:1 target. This thrust down has triggered a bearish setup mentioned last review, to reach the level of 96.1. After reaching that Pinbar’s target the market reversed rapidly with a Daily Kicker pattern, ending the whole week as a bullish Engulfing bar. But, eventually, it failed to gain the “bullish signature” on it by last Friday, making both the Quarterly and the Monthly bars closing while leaning on the trend line, a bearish picture for the short term.
In addition, pay attention to the crossing of the 50 SMA down the 20 SMA on the Daily timeframe, bearish indication for the Daily Swing.
However, if the market is still bullish for the short term, we should see the Weekly High being taken out right on the coming week. If that occurs, then the bearish setup emerged during the last Quarter is most likely rejected (it doesn’t mean that another bearish setup won’t be developing right after, but most chances in this case would be that the total bearish attempt has failed, and the market is heading upwards).
I would give more chances to the bearish case, meaning that the Weekly High is by most chances going to be respected. The current bearish setup (on the Monthly timeframe) points at 96.1 as its target. The real Stop is above the Monthly High, but for the coming week it is above the Weekly High, since such a thrust rejects that bearish setup -as explained before.
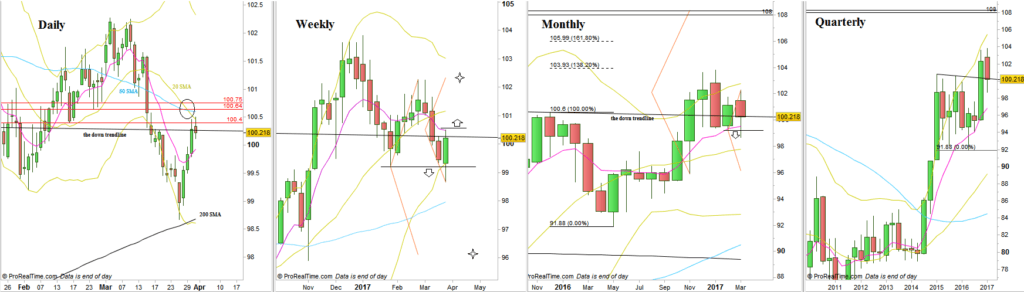
Dollar Index, various timeframes (at the courtesy of prorealtime.com)