
The 1st Quarter of 2017 ended with a Doji type of Weekly bar, still hanging above the 8 EMA short term sentiment line, but weak. The Weekly bullish Pinbar printed four weeks ago has failed to trigger the market up till the 7470 level as its Low (the Stop level) has finally been taken out.
The Monthly bar of March 2017 ended as a bearish Pinbar, but this is the 3rd consecutive Monthly bar to penetrate the upper Bollinger band, and won’t be a qualitative signal to go short.
The 1st Quarter of 2017 ended as a bullish bar (though with a relatively large upper tail), that has penetrated deeply the upper Bollinger band.
The Daily price action gives a trigger to both directions. Taking out the Swing High (also the Weekly High) at 7384.8 is a bullish signal to test again the all time High, while taking out the Swing Low (also the Weekly Low) at 7255.78 is a bearish signal to reach 7130, near the lows of February.
However, this bearish signal is not qualitative, as we are after a Monthly Spring (false thrust down turning into a reversal upwards). So, in case of the Weekly Low being taken out, I would suggest waiting for a false thrust down by a Daily bar that ends with clear signs of strength while respecting the next major Daily Low at 7192.45 (best to see a Daily bullish Pinbar). A thrust up above it right on the next bar is a very good bullish trigger to make a new all time High (printing a Daily Megaphone pattern eventually).
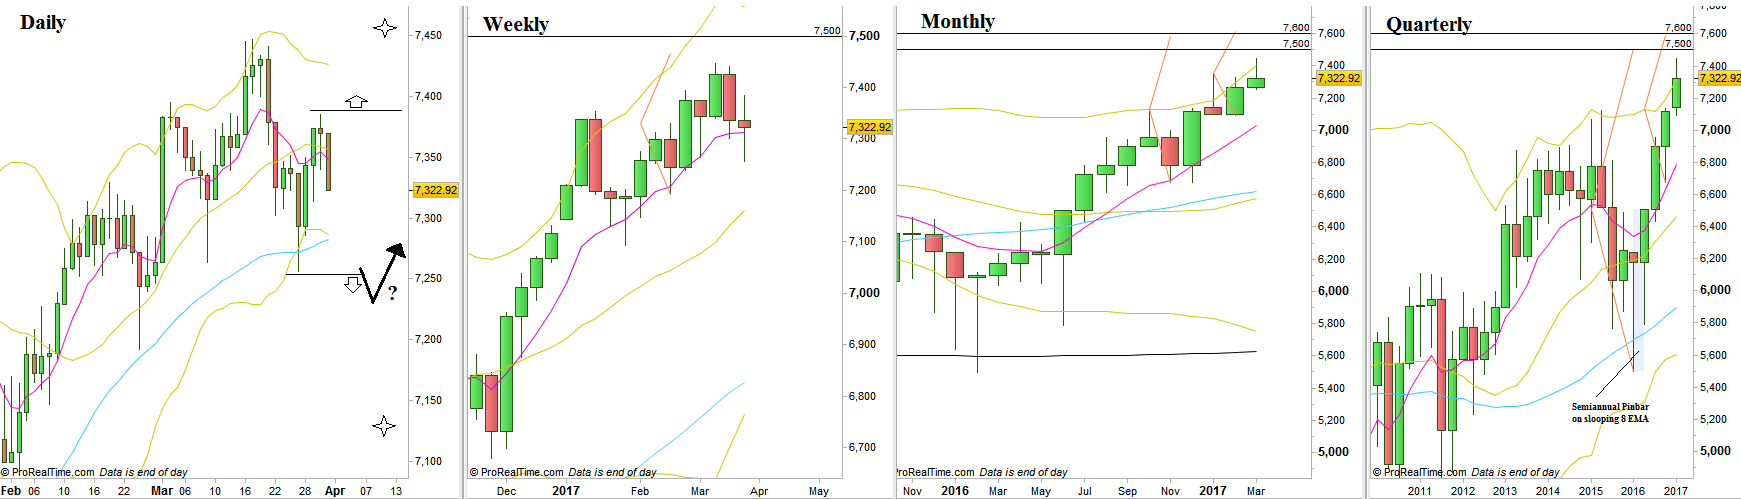
FTSE100, various timeframes (at the courtesy of prorealtime.com)
Disclaimer: Anyone who takes action by this article does it at his own risk and understanding, and the writer won’t have any liability for any damages caused by this action.