
One week before the end of the 1st quarter 2017, the Dollar Index is in a crucial area.
The Quarterly bar that is about to close by the end of the coming week is currently deep below the important down trendline mentioned many times before, a trendline which in a strong bullish case should have yield only a test from above.
In addition, the Current Monthly bar has already made an Upthrust (false thrust up) above the previous Month’s High, and taking out the Monthly Low at 99.195 is a bearish signal to reach the 96.1 area.
The Daily price action had penetrated deeply the support zone, and is currently yielding a bearish setup by the Daily bearish pinbar on sloping 8 EMA. A thrust down below the Daily Low, at 99.355 is a bearish setup to take out the Monthly Low and enter the bearish setup mentioned before (target at 96.1)
On the other hand, a thrust up above the Daily High at 99.815 is a bullish setup to reach back the down trendline area, and may continue the struggle on this line for the rest of the week. Major resistance levels for the Daily timeframe are at 100.4, 100.64 and 100.75.
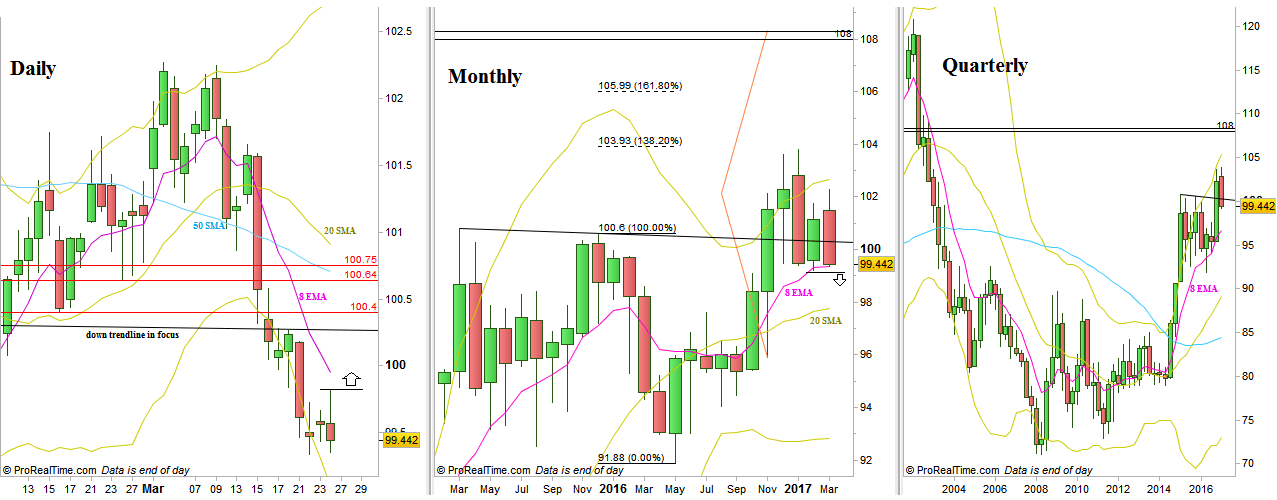
Dollar Index: Daily, Monthly and Quarterly charts (at the courtesy of prorealtime.com)
Disclaimer: Anyone who takes action by this article does it at his own risk and understanding, and the writer won’t have any liability for any damages caused by this action.