
Two weeks before the end of this quarter, a bearish week brought the Dollar Index price back to the major down trend line seen clearly on the Quarterly timeframe, mentioned many times before.
The bullish setup by the Follow Through model mentioned in the past reviews has failed.
Taking out the Weekly Swing Low at 99.195 is a major sign of weakness and is a signal to decline till 96. In this case, closing the Quarter with a Quarterly bar that negates the impressive break up that took place at the previous Quarter. The chances for such a move prior to the end of the quarter are very slim.
Currently, the Dollar Index is above a relatively strong support (the whole range above 99.5 and up to the current price), with an open gap (99.865-99.91). a Daily reversal up without closing this gap completely might be linked to a good bullish signal to reach back the 101 level, turning the price away from the down trend line. However, most chances are to see the struggle on the level of this down trendline continuing till the end of the quarter, two weeks from now.
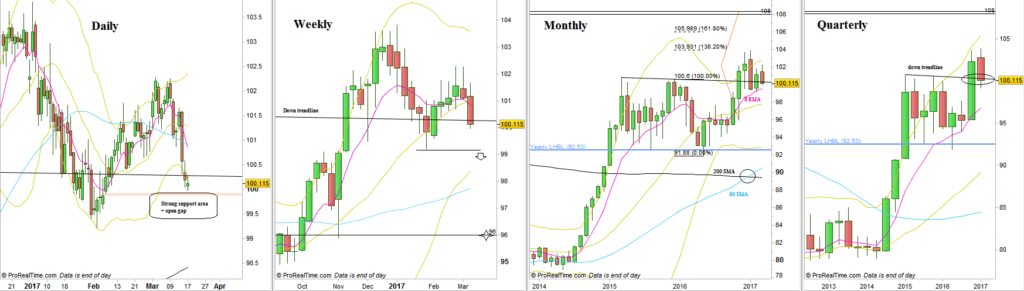
Dollar Index, various timeframes (at the courtesy of prorealtime.com)
Disclaimer: Anyone who takes action by this article does it at his own risk and understanding, and the writer won’t have any liability for any damages caused by this action.