The interesting Daily price action that tested once more the current resistance area at the 102 area failing to break up then declining (much due to the NFP report) closing finally the open gap created at the beginning of the month, has printed eventually an inner Weekly bar, much less important.
The major sign of weakness is taking out the last Daily Swing Low.
Vice versa, the signs of strength are the fact that the Daily Swing bearish move had penetrated the upper band before the decline, and the Weekly bar closing above the 8 EMA short term sentiment line, as well as the Daily bar closing above the 50 SMA.
Pay attention also the Daily 20 SMA crossing upwards the Daily 50 SMA on the passing week, so this kind of a pullback that took place on last Thursday and Friday is still “natural”.
The Bullish setup mentioned on the last review to reach 103.1 is still relevant, Stop is below 100.4, which lies approximately on the down trendline the Dollar index has been testing since last December. The target lies at the current Monthly upper Bollinger band.
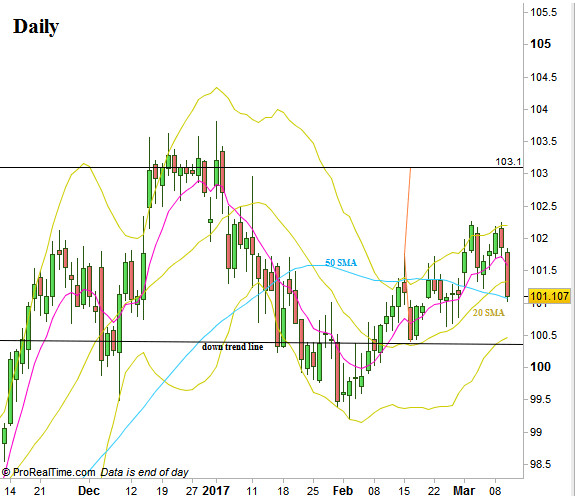
Dollar Index, Daily chart (at the courtesy of prorealtime.com)
Disclaimer: Anyone who takes action by this article does it at his own risk and understanding, and the writer won’t have any liability for any damages caused by this action.